
Initial CFD analysis of the gnuA7 wing with OpenFOAM
A deeper look at the wing with OpenFOAM: a wind-tunnel check of the codes, the 2D checks and the open air intake, the 3D mesh and the billow valleys, and a first use of the 3D pressures in the Playground
A report for the LEparagliding open-source community | Francois de Villiers | 16 November 2026, updated 17 November 2026 | Initial version
How to read this report
Every result carries one of three labels. Measured means a run or a file exists. Inferred means the result is a conclusion drawn from measurements and was not tested directly. Not done means what it says. Open points are listed as plain facts in section 10, with no recommendations, and the checks planned next are in section 11. Each figure has a caption that says what is drawn and what it shows. Terms such as calage, K, plumb point, x/c and FSI are explained in section 2.3.
The wing geometry, the design file format and the design numbers come from LEparagliding (Laboratori d'Envol) and from LEP Studio 0.4.2 (Michael Holm) but with big modifications over the last two months. OpenFOAM, Flow5 (with its XFoil), gmsh and ParaView were used as tools, and none of them was modified.
1. Summary
- Overall (inferred). The 2D results look promising. A fully resolved 2D mesh gives the boundary layer and the lift of rib 1, and it shows what a wall-function mesh costs. There is still a lot to learn with OpenFOAM, above all in 3D, where the billow valleys cannot yet be meshed with enough resolution and where the change from laminar to turbulent flow is not modelled.
- What was done. OpenFOAM v2512 (steady simpleFoam, kOmegaSST, wall functions) was run on the gnuA7 in 3D and in 2D. The 3D runs used snappyHexMesh meshes of 2 to 3.4 million cells at 3 to 15 degrees, with and without the billows of Studio's surface model. The 2D runs were on rib 1, closed and with the air intake open, on meshes of 43 thousand to 460 thousand cells. The 3D result differed greatly from the Flow5 panel method, so the modelling was checked step by step: first a wind-tunnel benchmark, then a 2D study of rib 1, where a fully resolved reference mesh is affordable. The 3D billow pressures were then used in the Playground and compared with the Flow5-based flights of the earlier report (Lep Studio test on gnuA7 (24 m2), 29 October 2026).
- Panel method against CFD (measured). At 9 degrees without the billow, Flow5 gives CL 0.711 and CD 0.0565, and OpenFOAM gives CL 0.600 and CD 0.0481. The lift-to-drag ratio is the same (12.6 against 12.5), and the Flow5 lift slope is 20 % above the CFD's (section 7.3). In a wind-tunnel benchmark on a different, rigid arched wing, the OpenFOAM lift slope is 7 to 8 % above the tunnel. The other codes are 17 to 31 % above, and Flow5 is 31 % above (section 3).
- 2D rib 1 (measured). At 9 degrees the real boundary layer on the upper skin is 6 mm thick at 10 % chord and 148 mm thick at 95 % chord. A wall-function mesh whose prism stack is thinner than that loses lift: a 59 mm stack loses 0.6 to 0.8 %, a 17 to 19 mm stack 4.6 to 5.6 % and an 8 mm stack 7.6 %, with 6 to 17 % more drag (sections 4.2 and 4.4).
- Turbulence and transition (measured). kOmegaSST without a transition model is not "fully turbulent" and has no trip position. With a transition model (9 degrees only) the upper skin stays laminar to 14 % chord, which matches the first seam at 400 mm (x/c 0.137). Lift rises 5 to 6 % and drag falls 26 % (section 4.5). The transition model has not been used in 3D, and a 3D check with a laminar front is listed as future work (section 11).
- Open air intake, 2D (measured). With the intake open, the lift equals that of the closed foil within 0.006 from 3 to 14 degrees. The drag is 30 % higher at 0 degrees and equal within 2 % from 11 to 14 degrees. The pressure inside the foil follows the stagnation pressure at the mouth: Cp -0.29 at 0 degrees, 0.21 at 3, 0.91 at 9 and 1.00 from 13 degrees (sections 5 and 6).
- 3D stacking and the billow valleys: not solved. snappyHexMesh builds a 17 to 19 mm stack at 95 % coverage. A 48 mm stack is only 77 to 80 % built and fails five mesh checks, and a 59 mm stack is hardly built at all. The creases of the billow stop stacks thicker than about 10 mm even on a simple slab. In the valleys the boundary layer is 36 to 59 mm thick, against 15 to 23 mm on the crowns (section 7).
- The 3D lift did not respond to the stack (measured), and the reason is unknown. Between the 8, 17 and 48 mm stacks the 3D lift differs by 0.9 % at every angle from 3 to 15 degrees, while the same change in 2D moves it by up to 7 %. The 3D lift and drag are repeatable but not confirmed as accurate (section 7.3).
- The Playground flown with the OpenFOAM pressures at 8, 9 and 10 degrees (measured). The design calage that flies the wing at 8, 9 and 10 degrees is 13, 20 and 24.8 % of the central chord, against about 30 % for 9 degrees with the Flow5 flights of the earlier report. At 9 degrees the speed is 11.0 m/s against about 9.5 m/s, and the glide ratio is 6.0, the same as in the Flow5 flights (5.96 to 6.01). The lift of the wing in the Playground equals the OpenFOAM lift at the flown angle within 1 %. The wing flies faster because the OpenFOAM pressure file has a lift coefficient of 0.534 at 9 degrees against 0.743 for Flow5, and its centre of pressure lies 7.6 percentage points of the chord further forward (inferred from the two pressure files). The plumb point lies 11 to 14 percentage points of the central chord behind the Cm = 0 point of the closed wing. The intake is a separate 2D term (1 to 3 N), and the trailing edge (1 to 2 % of the drag) is not included (section 8).
2. Introduction and set-up
2.1 Why OpenFOAM, and what this report covers
The Playground and the aerodynamic loop of the project need pressures on the canopy. Flow5's panel method delivers them quickly. Its pressures are those of potential flow: its viscous option adds skin friction, but in a test on the gnuC2 wing at 8 degrees it left the lift unchanged (1033.9 N without, 1032.9 N with the viscous option). The pressures therefore show no separation and no loss of lift from the boundary layer. A wind-tunnel test of a rigid arched wing (section 3) indicated that the other codes over-predict the lift slope, so a viscous solver was needed as a second opinion. OpenFOAM was chosen because it is free, runs on the PC used for the rest of the work, and can write its surface pressures in the file format that the Playground already reads.
This report follows the work in the order it happened. It starts with a wind-tunnel referee for the codes (section 3), because the 3D CFD differed greatly from the panel method. Then comes the 2D study of rib 1, where a fully resolved mesh is affordable: the boundary-layer and orthogonal-stacking analyses, the closed and the open air intake, and the internal pressure over the angle sweep (sections 4 to 6). After that the work goes back to 3D, with what was learned about stacking and about the billow valleys (section 7). The last part uses the 3D billow pressures in the Playground (section 8). It flies the wing at 8, 9 and 10 degrees by the calage and compares the result with the Flow5-based flights of the earlier report. The billow mesh is not yet satisfactory and the best method for the valleys is not settled, and the report says where.
2.2 The wing, the conditions and the reference results
- Wing. gnuA7 (LEP design gnuA7-24), half wing with a symmetry plane, ribs 1 (near the centre) to 17 (tip). Rib 1 has a chord of 2.91336 m, a thickness of 17.7 % at x/c 0.24 and a camber of 2.9 %. The half wing spans 4.2 m. The projected area of the full wing is 20.73 m2 in the CFD coefficients, and the reference chord is 2.59 m.
- Conditions. Air speed 9.1107 m/s, kinematic viscosity 1.5e-5 m2/s, Reynolds number 1.57 million on the reference chord (1.77 million on rib 1), angles of attack 3 to 15 degrees.
- Geometry sources. The 3D CFD uses surface models made by Studio: one version with 12 segments per cell between the ribs ("billow") and the same wing with one segment per cell ("no billow", a flat chord between the ribs). The 2D study uses the LEP rib-1 foil exactly as LEP writes it for Flow5 (140 points).
- Reference results. The Flow5 3D panel method with XFoil polars for the drag (XFoil trip at 2 % chord); a non-planar lifting line built from the 2D polars; and the Belloc wind-tunnel test of a rigid arched wing, which is a different wing and is used to judge the codes.
2.3 Terms used
- Cp, CL, CD, Cm. The pressure, lift, drag and pitching-moment coefficients. In pressure plots up means suction (negative Cp) unless a caption says otherwise. q is the dynamic pressure, half the air density times the speed squared.
- Wall function and y+. A wall function replaces the thin layer next to the skin with a formula, so the first cell can be much thicker than the viscous sub-layer. y+ is the height of the first cell centre in wall units. About 1 means "resolved", and 20 to 50 is typical for wall functions.
- Prism layers and "stack". Thin cells grown from the skin outwards, in layers perpendicular to the surface. The "stack" is their total thickness, and "coverage" is the share of skin faces that really received the layers.
- Boundary-layer edge. The height where the total pressure has recovered to within 1 % of the free stream. It shows how thick the stack would have to be to contain the boundary layer.
- Billow. The bulge of the cloth between two ribs. In Studio's model (Section 37, line 1291) each cell panel is a circular arc cut into 12 segments. The line where two panels meet is a crease, or "valley", that runs along the flow.
- Playground. Studio's model of the whole wing under load (dynamics, loading, trim). It takes the pressure on every cell from a file, for example one written from a CFD sweep (section 8).
- 2.5D slab. A thin slice of the wing: one section stretched sideways a short distance between mirror walls. The flow is effectively 2D, but the mesh behaves like the 3D mesh.
- x/c. The position along the chord as a fraction of the chord length, measured from the nose: 0 is the nose and 1 is the trailing edge.
- Calage, design calage and K. The calage is the position of the karabiners (where the pilot hangs on the risers), given as a percentage of the central chord measured from the nose along the chord line. The design calage is the value set in the design file (Section 8). K is the calage at which the flown wing settles. A difference in calage or in the position of a point on the chord is given in percentage points of the central chord, shortened to "points".
- Plumb point and Cm = 0 point. The plumb point is where the vertical line through the pilot meets the central chord, as a percentage of the central chord from the nose (the spot that a laser pointed straight up from the pilot would hit). The Cm = 0 point of the closed wing is the centre of pressure of the OpenFOAM force on the wing alone, without lines and pilot, on the same scale.
- FSI. Fluid-structure interaction: the load deforms the canopy, and the deformed canopy gets new loads, until the two agree.
2.4 Set-up of the runs
| Item | Setting |
|---|---|
| Solver and model | OpenFOAM ESI v2512 in WSL2 (Ubuntu 22.04); steady simpleFoam; kOmegaSST; wall functions (nutUSpalding, omegaWallFunction, kqRWallFunction); no transition model unless stated; linearUpwind for velocity, first-order upwind for k and omega unless stated |
| 3D mesh | snappyHexMesh in two passes (castellate and snap, then layers only); 2 to 3.4 million cells (4.15 million for the finest mesh); refinement of the nose and of a band along the billow creases in the later meshes; stack 8 to 48 mm |
| 2D mesh | gmsh quad layers on a cubic spline through the LEP foil points, converted with gmshToFoam; 43 thousand to 460 thousand cells; every mesh is a named preset of one script |
| Stopping | Force-based: stop when CL, CD and Cm each vary less than a small band over 100 iterations; residuals alone do not reach 1e-6 on these meshes |
| Hardware | One laptop-class PC (6 cores, 32 GB; WSL sees 15 GB); 6 MPI ranks; 25 to 110 minutes per 3D angle when restarted from the neighbouring angle |
3. Is the modelling correct? A wind-tunnel referee
The 3D OpenFOAM lift at 9 degrees is about 16 % below the Flow5 panel method (section 7.3). The question was whether viscous RANS or the panel method is closer to a real wing. A published wind-tunnel test of a rigid arched wing served as the referee (Belloc, J. Aircraft 52(2), 703-708, 2015). That wing is a rigid 1/8-scale model with a NACA 23015 section and 12 line segments, with a flat area of 28.56 m2 at full scale, measured in an open elliptical 3 m by 2 m test section at a Reynolds number of 0.92 million (central chord) and a turbulence intensity of 0.5 %. It is not the gnuA7. It is a benchmark for the codes and not for the gnuA7 numbers. The paper applies no wall corrections and says nothing about transition. The same STEP model that was used in October for the ParaCFD (a GPU cut-cell code), VSPAERO and Flow5 runs was run in OpenFOAM with the same dictionaries and layer settings as the billow work (2.45 million cells).
- Lift slope (measured). Over -4 to +4 degrees OpenFOAM gives 3.26 per radian at 10 m/s (Re 1.9 million) and 3.23 per radian at the tunnel's Reynolds number, against 3.01 in the tunnel. That is +8.3 % and +7.4 %. The Reynolds number explains only about 1 % of the gap. The other codes give +17 to +25 % (ParaCFD wall law on 3.51, slip wall 3.69; VSPAERO 3.72 to 3.75), and Flow5 gives +31 % (3.94 to 3.96) (Figure 1).
- The slope alone understates the gap (measured). Digitised from the paper's figures, the OpenFOAM lift at equal angle is 0.024 higher at -4 degrees and 0.078 higher at 8 degrees (+24 % at 4 degrees). The angle of zero lift is -1.45 degrees against -0.75 in the tunnel. The pitching moment about the central quarter chord is 0.017 to 0.021 below the tunnel at all lifts. The drag at the tunnel Reynolds number is within 4 % at CL 0.3 and 29 % low at CL -0.15 (Figure 2).
- Size of the unknowns (inferred). The paper's own flat-wing correction formula would raise the tunnel slope by about 4 % (to 3.13 to 3.15). The author states that the formula does not apply to an arched wing, so this is a sensitivity estimate and not an error bar. The reference area used for the tunnel coefficients (0.4440 m2, which is 28.42 m2 at full scale) is 0.5 % below the 28.56 m2 used for the codes' CL.
- Not tested. Mast and balance interference, tunnel interference, the model's incidence and twist against the paper's table, transition at 0.5 % turbulence, and free air against the open test section.
Reading (inferred): viscous RANS is much closer to the tunnel than any of the other codes. This supports the view that the panel method over-predicts the lift of a real arched wing. It does not show that the OpenFOAM numbers are correct to within a few per cent.
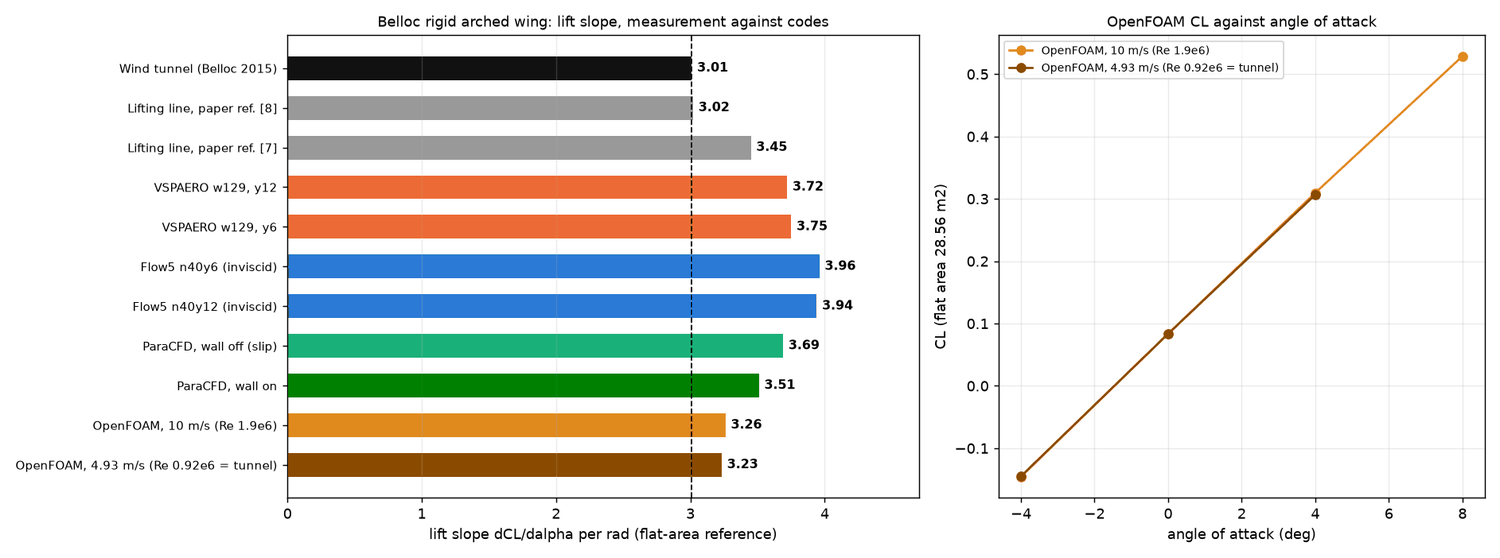
Figure 1. Lift slope of the Belloc wing: tunnel against codes. Left: horizontal bars of dCL/dalpha per radian (flat-area reference). Black: the wind tunnel (3.01), also marked by the dashed vertical line; grey: two lifting-line results quoted in the paper; red-orange: VSPAERO; blue: Flow5 (inviscid); green: ParaCFD with the wall law off (slip) and on; orange and brown: OpenFOAM at 10 m/s and at the tunnel's Reynolds number. Right: the OpenFOAM CL against angle, from which the OpenFOAM slopes are taken; the two Reynolds numbers lie on top of each other.
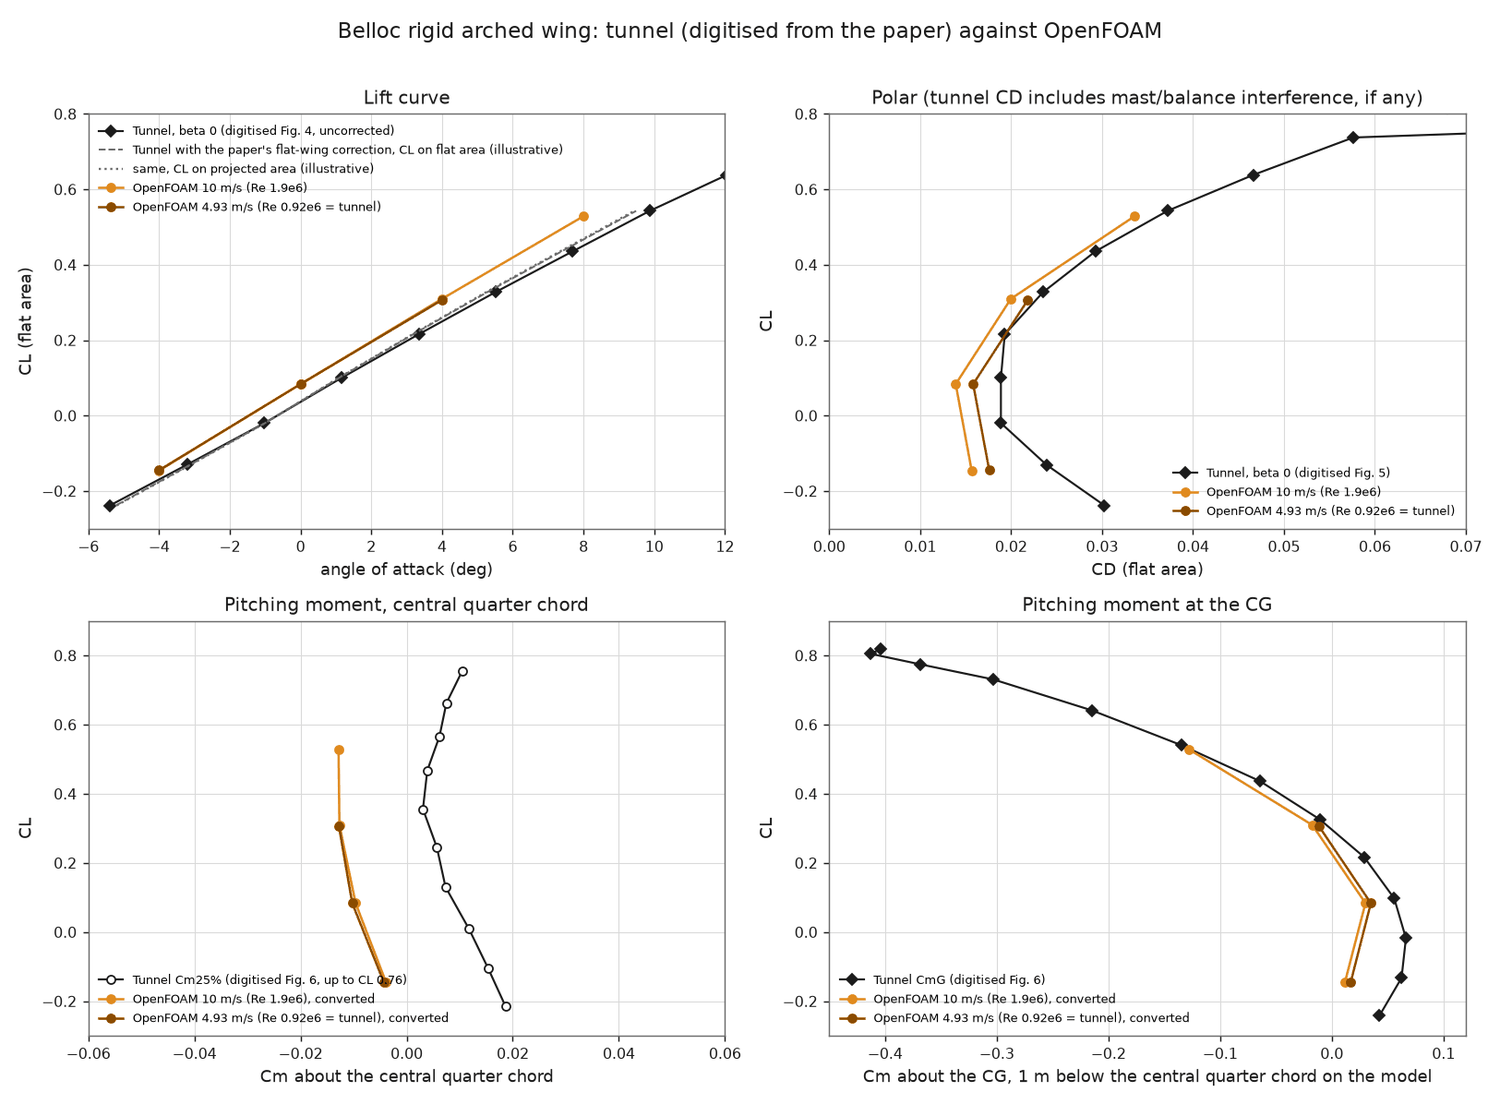
Figure 2. The Belloc wing: tunnel (digitised from the paper) against OpenFOAM. Top left: lift curve; black diamonds are the tunnel data, grey dashed and dotted lines show the paper's flat-wing correction (illustrative), orange and brown are OpenFOAM at 10 m/s and at 4.93 m/s (tunnel Reynolds number). Top right: polar, CL against CD. Bottom left: pitching moment about the central quarter chord. Bottom right: pitching moment about the centre of gravity, 1 m below the quarter chord on the model. The OpenFOAM lift curve is parallel to the tunnel's but shifted up; the moment about the quarter chord is offset by about 0.02.
Why the work went back to 2D. The tunnel test shows which code is closer to a real wing, but not how accurate a 3D mesh is. A 3D wall-function mesh cannot be checked against a fully resolved 3D mesh, because that is impossible on this PC. A 2D section can be checked. Rib 1 can be meshed with a first cell 0.04 mm high and tens of layers at a small fraction of the 3D cost, compared with XFoil (the program inside Flow5), and then degraded to the kind of mesh that snappyHexMesh builds in 3D, to see what that costs. This is the 2D study of section 4. In 2D the 3D recipe was therefore tested before anything more was built in 3D.
4. The 2D study of rib 1
4.1 Foil, mesh presets and the reference
The foil is the LEP rib-1 section (gnua.txt scaled by 0.9; chord 2.91336 m; the same points that LEP writes for Flow5/XFLR5), at a Reynolds number of 1.77 million, with kOmegaSST and the 3D settings (inlet turbulence 0.5 %, eddy-viscosity ratio 10). Every mesh is one named preset of a single script. The preset sets the surface cell size, the nose and trailing-edge sizes, the wake size, the first-layer height, the growth ratio, the stack thickness and the trailing-edge treatment. One script run makes the mesh, and a second one converts it, builds the case and checks it. The reference is the fully resolved mesh with a flat trailing-edge base ("st3rkx": 0.04 mm first layer, growth 1.09, one uniform 202 mm stack, 457 thousand cells). At 9 degrees it gives CL 1.0634 and CD 0.0191.
First 2D results (9 November, measured). A mesh that copies the 3D recipe (42,651 cells, four layers of 1.5 mm, y+ 17 to 20) gave CL 0.959 and CD 0.0232 at 9 degrees. XFoil with a trip at 2 % chord gave 1.033 and 0.0162, and XFoil with free transition gave 1.157. Early resolved meshes gave 1.11. The wall-function mesh separated at 78 % chord. Both references were revised later, as sections 4.3 and 4.5 show.
4.2 Analysis A: how thick is the boundary layer compared with the mesh?
The edge of the boundary layer was extracted from the resolved solution at every angle and drawn on the meshes (Figures 3 and 4). At 9 degrees on the upper skin it is 6, 14, 24.5, 37, 49, 62, 75, 98, 125 and 148 mm thick at x/c 0.1, 0.2 and so on to 0.95 (the 1 % total-pressure edge, measured). The "resolved" mesh used first has a 71 mm stack, so it contained the boundary layer only to about 65 % of the chord and was not resolved in the aft third. A stack of 12 layers and 59 mm covers the boundary layer only forward of x/c 0.6. It has 8 to 22 cells inside the layer where the reference has 33 to 53, and it ends inside the layer. The lower skin is thinner (10 to 39 mm). At higher angles the layer grows quickly: on the upper skin at x/c 0.9 it is 86 mm at 4 degrees and 369 mm at 15 degrees, and it leaves the 71 mm structured band at x/c 0.7 at 14 degrees and at x/c 0.45 at 15 degrees.
The cell count alone does not decide the result. The 3D-style mesh (7 to 20 cells in the layer) and the 59 mm stack (8 to 22 cells) have similar counts, yet their lift differed by 13 % (0.959 against 1.088 at 9 degrees; measured, before the trailing-edge artefact of section 4.3 was found). A stack that follows the local boundary-layer thickness (59, 108 and 159 mm over three parts of the chord) appeared to recover nearly all of the gap to the 165 mm mesh (CL 1.1407 against 1.1593). Most of that gain turned out to be the trailing-edge artefact described next.
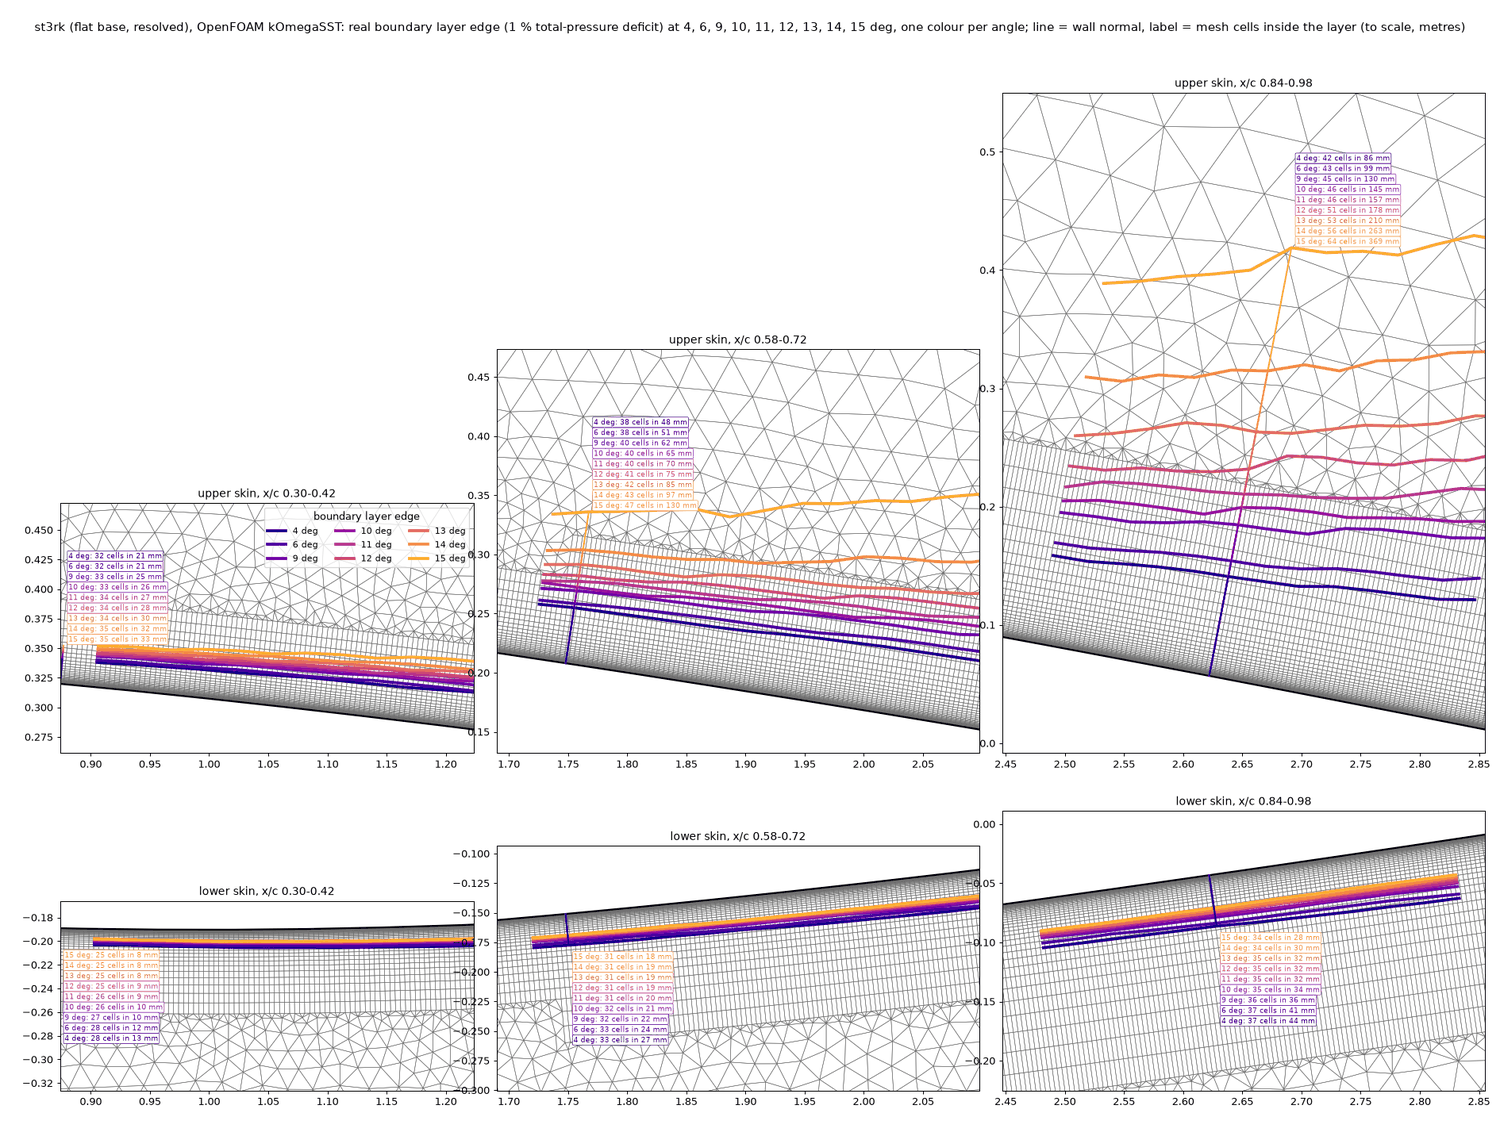
Figure 3. The real boundary-layer edge drawn on the reference 2D mesh (angles 4 to 15 degrees). Six windows of the mesh (upper skin above, lower skin below) at x/c 0.30 to 0.42, 0.58 to 0.72 and 0.84 to 0.98; the thin grey lines are mesh cells (the dense band next to the wall is the prism stack, the triangles outside it are the free mesh). Each coloured line is the edge of the boundary layer at one angle (dark blue 4 degrees to orange 15 degrees); the text boxes give the number of cells inside the layer and its thickness in mm (for example 42 cells in 86 mm at 4 degrees and 64 cells in 369 mm at 15 degrees near the trailing edge). The edge climbs out of the structured band on the upper skin for the higher angles; on the lower skin the layer stays thin.
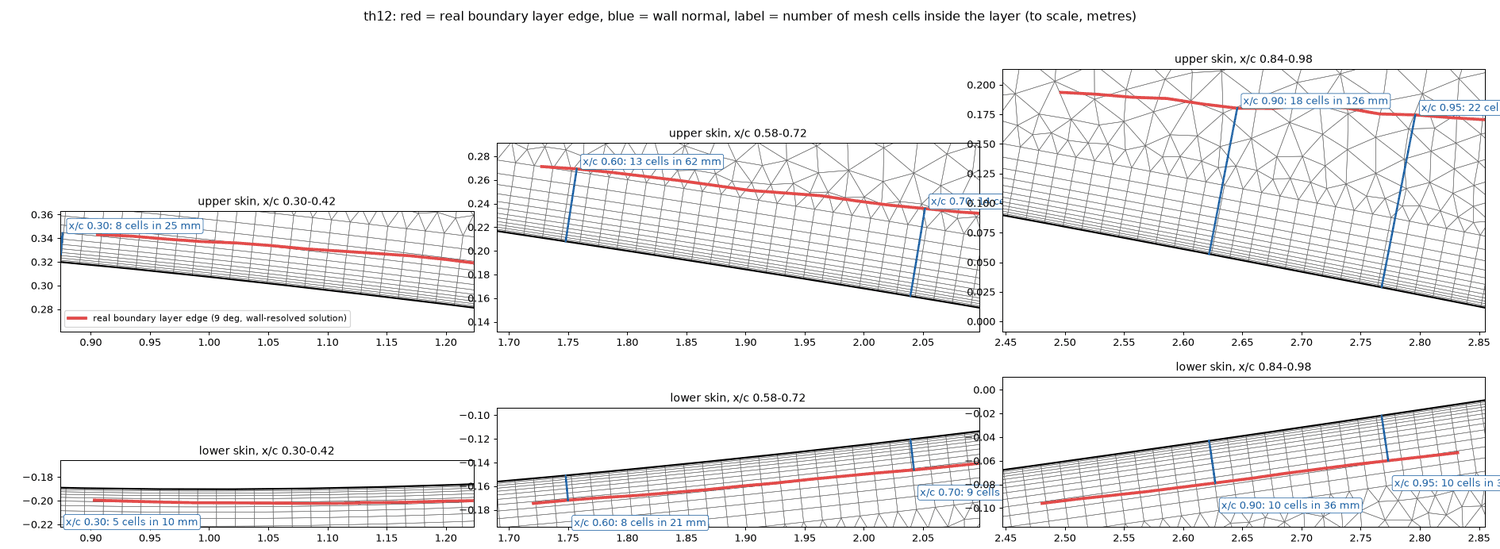
Figure 4. The boundary layer against a 59 mm wall-function stack. The same windows for the 12-layer, 59 mm stack (mesh "th12"). The red line is the real boundary-layer edge of the 9-degree resolved solution, the blue lines are wall normals and the labels count the cells between the wall and the red line (for example 8 cells in 25 mm at x/c 0.30, 18 cells in 126 mm at x/c 0.90 on the upper skin; 5 to 10 cells on the lower skin). Upper skin: the red line leaves the structured stack at about 60 % chord.
4.3 Analysis B: orthogonal stacking and the trailing edge
A good stack has its cells perpendicular to the wall all along the foil. At the sharp trailing edge this is impossible. gmsh closes the stack with a fan of slanted cells, a semicircular cap whose radius equals the stack thickness, and all the highly skewed faces of the mesh sit at the apex of that fan. Because the fan grows with the stack, it looked like a gain from a thicker stack. The trailing edge was therefore replaced by a flat base: the foil is cut 2 mm short of the tip (0.07 % of the chord), which leaves a 0.70 mm flat base. The layers end in a clean cut and the gap behind is filled with triangles (Figure 5).
At 9 degrees (measured) the flat-base meshes with different stacks give CL 1.0538 to 1.0640, a spread of 1.0 %. The same stacks with the fan give 1.0876, 1.1407 and 1.1622, a spread of 6.9 %, and a fan limited to four elements gives 1.0631. The earlier statements that a thick or stepped stack adds 4 to 7 % of lift, and the 165 mm "fully resolved" reference of 1.159, were therefore artefacts of the fan. Every earlier percentage of "gap closed" that used them is withdrawn. With a flat base the stack thickness matters by less than 1 % in the thick-stack regime. The boundary-layer thickness itself is the same with and without the fan, so the fan changed the circulation and not the boundary layer. The flat base adds a small base drag that XFoil does not have. The layer cells are perpendicular to the wall along the whole foil by construction. Only a few faces exceed the non-orthogonality limit of 70 degrees (2 to 29, depending on the mesh), and they sit at the trailing edge and, in the open mesh, at the cavity end. The flat-base meshes still report two failed checkMesh categories (small-determinant cells and low-weight faces). With a flat base the forces of the different presets agree within 1 %.
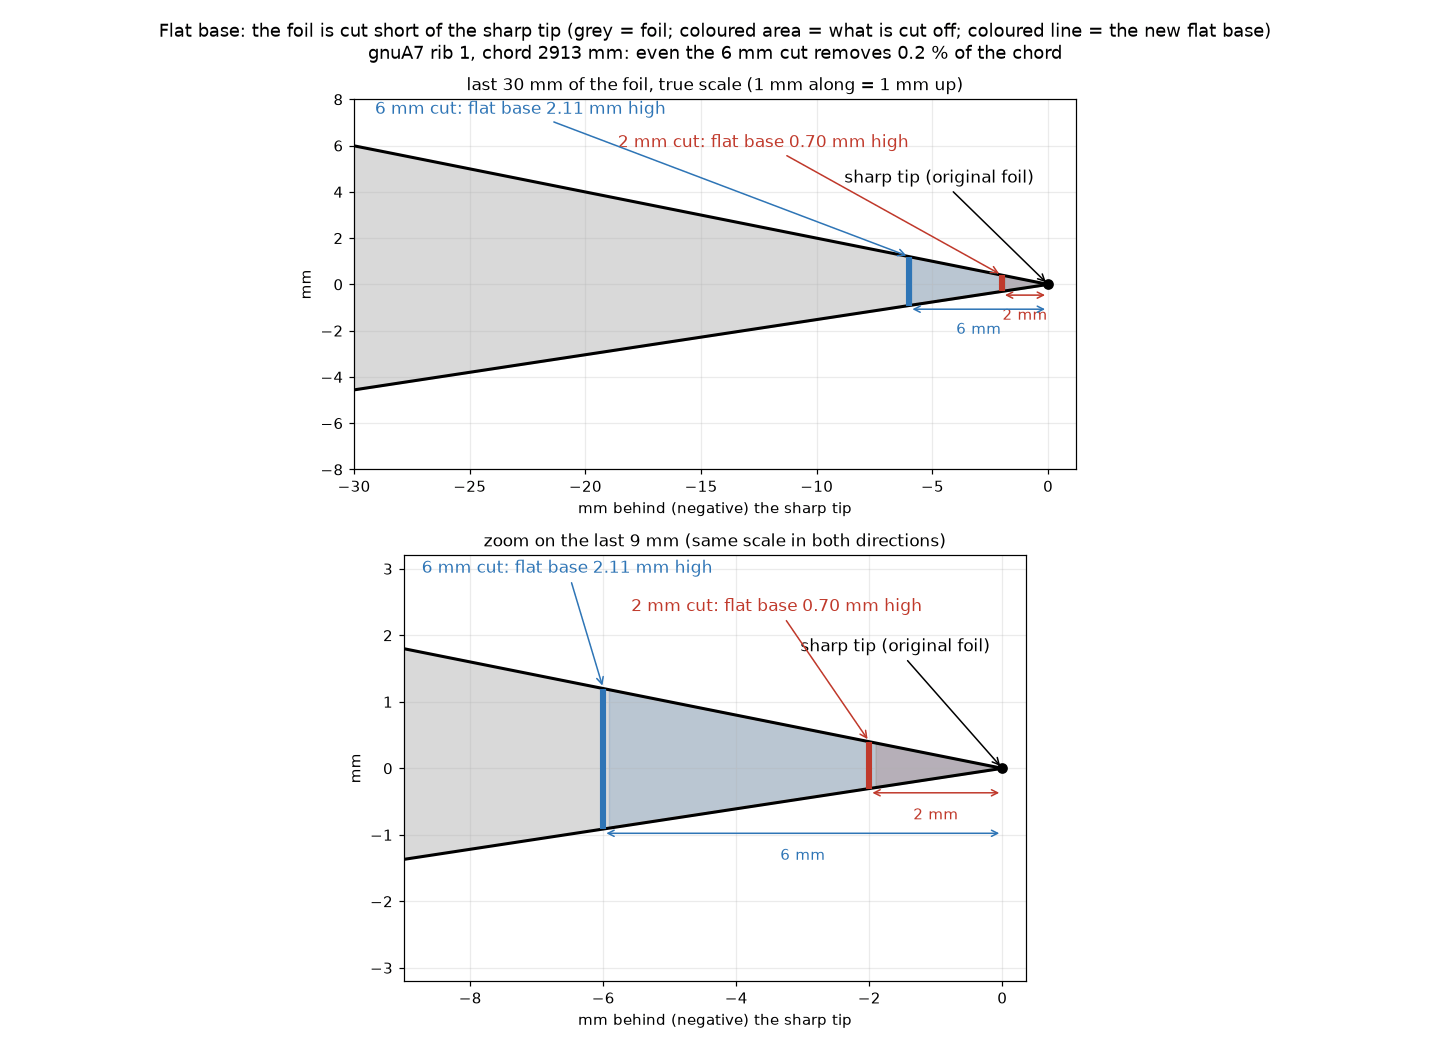
Figure 5. The flat trailing-edge base. Top: the last 30 mm of the rib-1 foil drawn to true scale (1 mm along is 1 mm up). The grey shape is the foil, the black dot is the sharp tip; the red bar is the flat base made by a 2 mm cut (0.70 mm high), the blue bar the larger base of a 6 mm cut (2.11 mm high), and the coloured areas are what is cut off. Bottom: a zoom on the last 9 mm with the same scale in both directions. Even the 6 mm cut removes only 0.2 % of the 2913 mm chord.
What the real trailing edge is, and what the model leaves out (described by the author, not measured in this study). On the wing the cloth of the upper and lower skin is folded three or four times at the trailing edge into a flat seam about 1 cm long and 1 to 1.5 mm thick (Figure 5b). The thickness is an estimate, not yet resolved, and is left for fine tuning. The internal pressure pushes the two skins apart, so they bulge into an almost round profile that runs into this seam. The 0.70 mm flat base of the CFD is of the same order as the seam thickness, but it is a cut foil with a flat base and not a rounded bulge feeding a seam. None of this has been modelled correctly in any run of this report (not done). The trailing edge was checked thoroughly on a single open cell of the gnuC2 wing in earlier work. The same check for the gnuA7, on a single cell in the Playground, has not been made yet (not done). The author wants the following analysed at every angle of attack (not done): the radius of the rounded end that the internal pressure produces, the seam, the back (the base behind the seam) and the mesh around them.
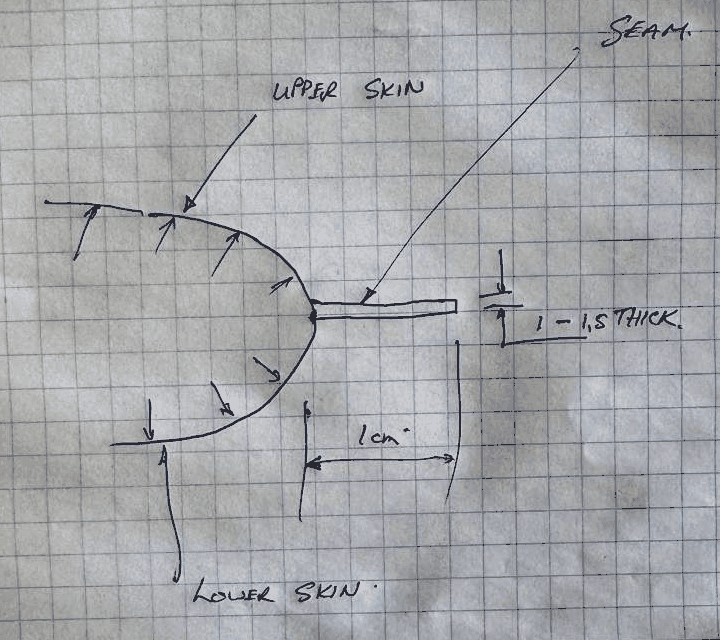
Figure 5b. The real trailing edge, in the author's hand sketch (photograph of the sketch, not to scale). The upper skin and the lower skin come together at the trailing edge. The small arrows are the internal pressure pushing both skins outwards, which rounds the end. A flat seam leaves the round end towards the back: about 1 cm long ("1 cm") and "1 - 1.5 thick" (the unit is not written on the sketch; millimetres are meant, as in the text). The CFD of this report replaces all of this by a foil with a 0.70 mm flat base (Figure 5).
4.4 Wall-function stacks against the resolved mesh
With the flat base, the stack was reduced step by step on a surface mesh of the 3D kind, to find out what a wall-function mesh costs. All runs are at 9 degrees, against the resolved reference of CL 1.0634 and CD 0.0191 (measured):
| Stack | CL against the reference | CD against the reference |
|---|---|---|
| 59 mm (12 layers) | -0.6 to -0.8 % | +6 to +7 % |
| 48 mm (2 mm x 8, growth 1.3) | -1.3 % | +5 % |
| 34 to 40 mm | -2.6 to -3.6 % | |
| 17 to 19 mm | -4.6 to -5.6 % | +12 to +13 % |
| 8 mm | -7.6 % (CL 0.982) | +17 % (CD 0.0224) |
Fewer layers with faster growth do not help, and y+ of 20 against 38 makes no difference. The thickness of the stack decides, not the first-cell height. Wall functions also fail earlier at high angle: at 12 degrees the lift is 2 to 4 % low even with the 59 mm stack, and at 15 degrees the wall-function runs break down (not converged). On the closed foil the usable range of the wall-function approach is therefore up to about 9 to 11 degrees.
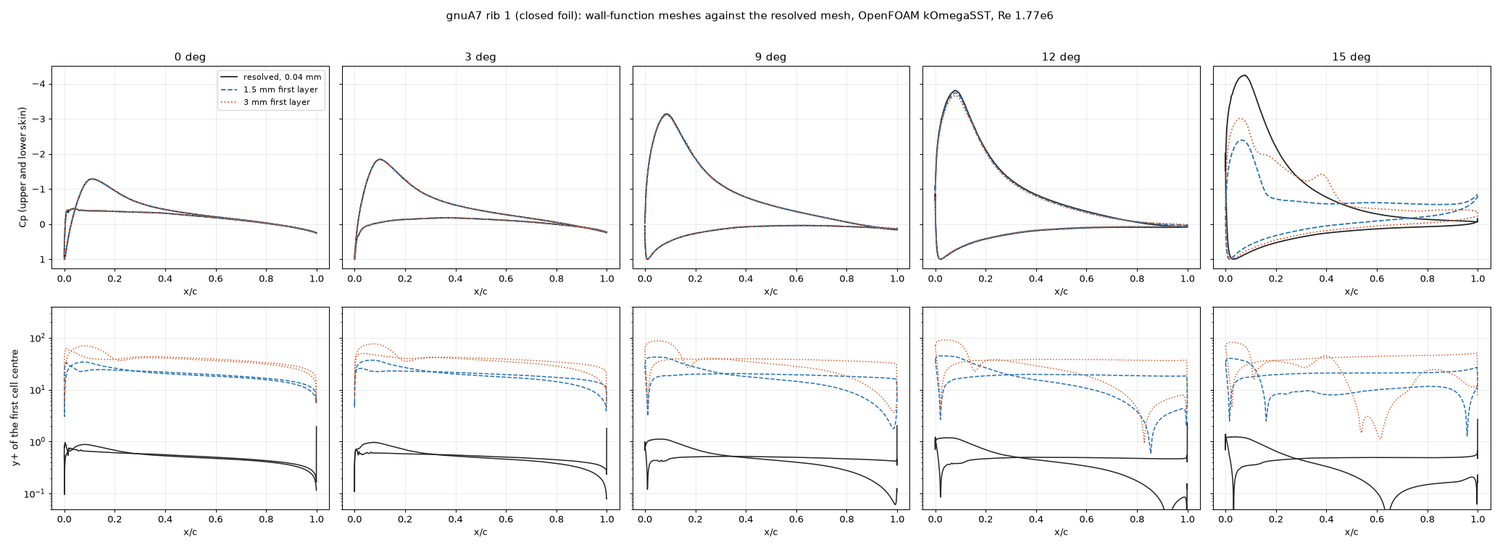
Figure 6. Wall-function meshes against the resolved mesh on rib 1. Top row: Cp (suction upwards) on both skins at 0, 3, 9, 12 and 15 degrees; bottom row: y+ of the first cell on a logarithmic scale. Black: resolved mesh (first cell 0.04 mm, y+ below 1); blue dashed: 1.5 mm first layer (y+ about 20); red dotted: 3 mm first layer (y+ about 40). The pressure distributions are the same up to 9 degrees; at 12 degrees the wall-function suction peak is slightly lower, and at 15 degrees the wall-function runs have lost the suction peak (-2.4 and -3.0 against -4.2) and the flow is separated.
4.5 Polar, turbulence and transition
The resolved flat-base mesh was run at 4 to 15 degrees (measured, Figure 7). CL is 0.574, 0.778 and 1.064 at 4, 6 and 9 degrees, then 1.153, 1.236, 1.312, 1.378, 1.422 and 1.420 at 10 to 15 degrees. CD rises from 0.0210 at 10 degrees to 0.0437 at 15 degrees. The maximum lift of about 1.42 is reached at 14 to 15 degrees with a soft stall, and the separation point moves from 96 % chord at 11 degrees to 62 % at 15 degrees.
The comparison with XFoil showed that the OpenFOAM runs are not "fully turbulent" (a wrong label that was used earlier and is withdrawn). kOmegaSST has no transition model, so the layer turns turbulent gradually over x/c 0.1 to 0.4 (eddy viscosity ratio 0 at 0.005, 6 at 0.05, 13 at 0.1, 45 at 0.2 and 118 at 0.4 on the upper skin). XFoil's own lift at 9 degrees depends on where the transition is placed: 1.023 with a trip at 0.1 %, 1.033 at 2 %, 1.054 at 5 %, 1.089 at 10 %, 1.110 at 15 % and 1.157 free. The flat-base OpenFOAM lift (1.054 to 1.064) lies on the 5 % trip, but the drag is higher than in every XFoil case (0.0192 against 0.0109 free and 0.0153 at a 5 % trip). The earlier statement that kOmegaSST "trips" at 4.5 to 5 % chord was an over-reading of the shape factor and is withdrawn. Changing the inlet turbulence from 0.1 to 2 % and the viscosity ratio from 1 to 10 changed nothing (CL 1.0639 to 1.0644). The turbulence is produced near the nose and is not carried in from the inlet.
A transition model (kOmegaSST with the gamma-Re-theta transition model) was run at 9 degrees only (measured, Figure 8). It gives CL 1.117 to 1.129 and CD 0.0140 to 0.0142, against 1.064 and 0.0192 for the baseline. The upper skin is laminar to x/c 0.14, has a laminar bubble between 0.14 and 0.17 and is turbulent after 0.2. This agrees with XFoil's natural transition and with the first seam of the real wing at 400 mm (x/c 0.137 on rib 1). The lower skin stays laminar to the trailing edge, as in XFoil. The 2D model has no air intake, so this is an upper bound on the laminar run. XFoil's natural transition on the upper skin lies at x/c 0.124 to 0.241 over critical amplification factors of 2 to 12 and angles of 0 to 10 degrees. The transition model was not used for the 3D work (not done in 3D), so the 3D drag includes a layer that turns turbulent gradually rather than at the seam (inferred from the 2D behaviour).
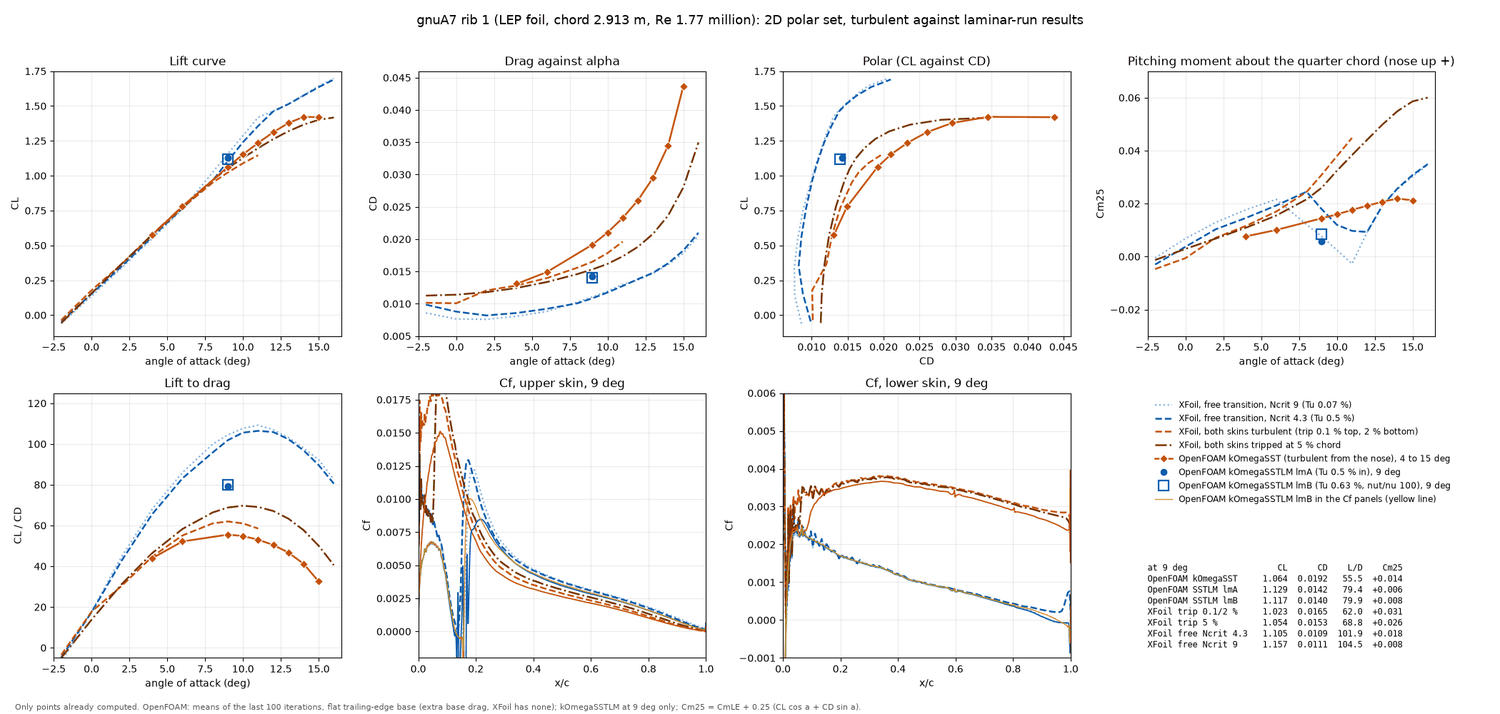
Figure 7. The 2D polar set of rib 1 (Reynolds number 1.77 million). Top row: lift curve, drag against angle, polar (CL against CD) and pitching moment about the quarter chord (nose-up positive). Bottom row: lift-to-drag ratio, and skin friction coefficient Cf along the upper and the lower skin at 9 degrees. Orange diamonds with a solid line: OpenFOAM kOmegaSST (4 to 15 degrees); blue circle and square: OpenFOAM with the transition model at 9 degrees (two inlet settings); blue dashed and dotted: XFoil with free transition; orange dashed: XFoil with both skins turbulent from the nose (trip at 0.1 % on the upper and 2 % on the lower skin); brown dash-dot: XFoil with both skins tripped at 5 % chord. A table at the lower right lists the 9-degree values (for example kOmegaSST CL 1.064, CD 0.0192; transition model 1.129, 0.0142; XFoil free at critical amplification 4.3: 1.105, 0.0109). Free transition gives much less drag and a laminar run on the upper skin to 14 % chord; the kOmegaSST drag lies above all of the XFoil cases.
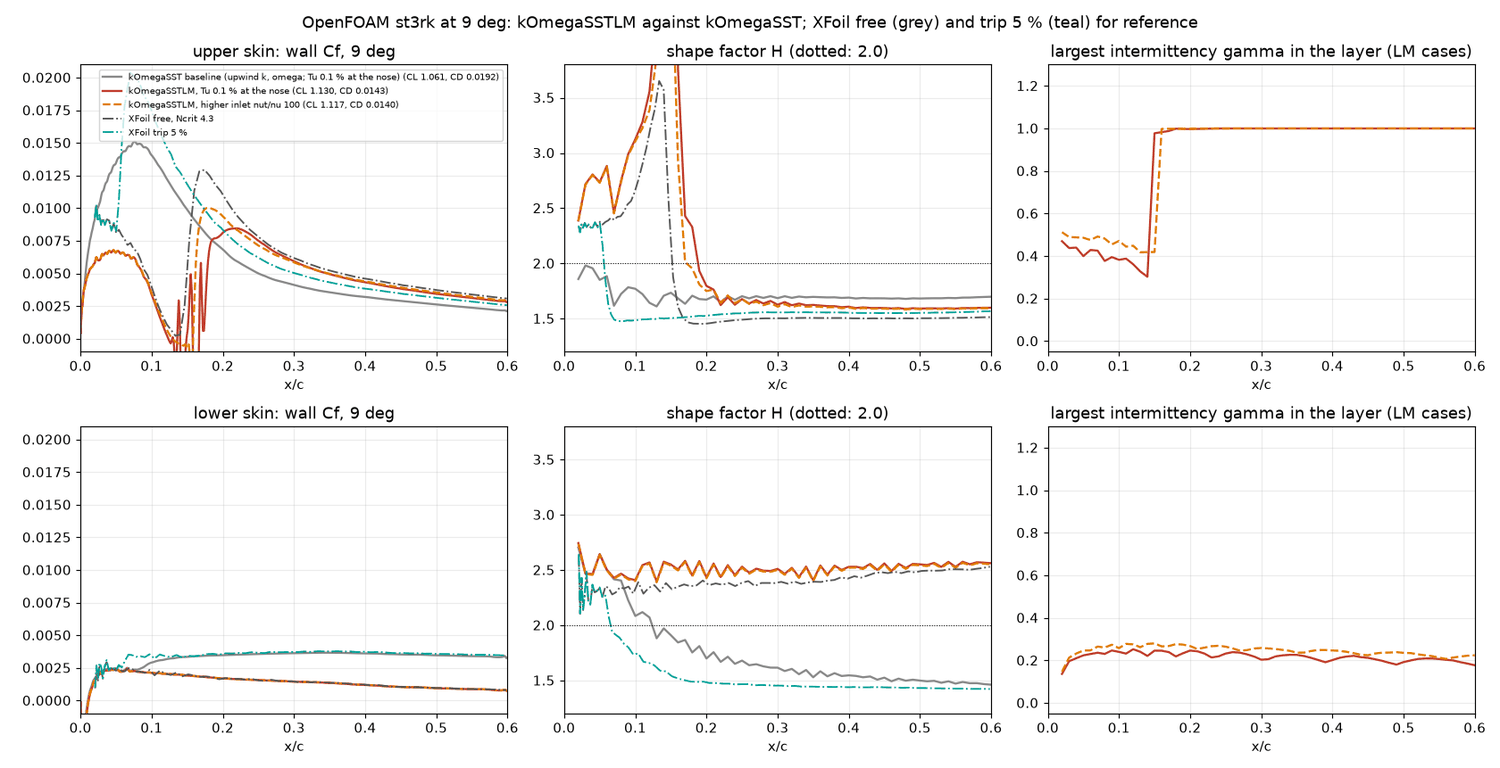
Figure 8. The transition model against kOmegaSST (9 degrees, first 60 % of the chord). Top row: upper skin; bottom row: lower skin. Left: skin friction Cf; middle: boundary-layer shape factor H (dotted line H = 2); right: the intermittency gamma of the transition model. Grey: kOmegaSST baseline; red and orange: the two transition-model runs; dash-dot lines: XFoil free transition and a 5 % trip. With the transition model, Cf on the upper skin follows XFoil: low and laminar up to x/c 0.14, a short bubble (Cf touches zero at x/c 0.14 to 0.17) and the jump to the turbulent value; the intermittency jumps from 0.4 to 1.0 at x/c 0.15. On the lower skin the layer stays laminar (gamma 0.2).
4.6 Towards an automatic mesh
The aim of the mesh work is that a new foil or a new angle needs no hand work. This is the state on 16 November (measured where a script exists):
- 2D: scripted end to end. A foil file goes through the mesh script (the presets), the conversion and case-building script, the force-stopped sweep script (restart from the neighbouring angle, stop when the forces stop changing) and the extraction scripts (Cp, Cf, y+, boundary-layer edge on the mesh, cells across the layer). The boundary-layer edge drawing of Figures 3 and 4 is itself an automatic check that the stack contains the layer.
- Rules learned that can be coded. Use a flat base instead of a sharp edge. Use a stack that follows the local boundary-layer thickness (thick aft, thin on the lower skin) rather than one constant value. Never end the stack inside the layer.
- 3D: partly scripted. The two-pass snappyHexMesh script, the layer-coverage map and the angle sweeps with force-based stopping run unattended through the night (Windows Task Scheduler queues). The layer parameters, however, were found by trial for each geometry, and the 3D mesher builds only thin stacks (section 7).
- Partly done. The night queues skip the solver when the layer coverage is below a threshold (80 % or 90 %, set by hand in the queue scripts). There is no gate on non-orthogonality or on checkMesh.
- Not done. Adapting the stack thickness automatically from a first solution, and a 3D recipe that follows the boundary-layer thickness.
- Direction (stated by the author). Both the 2D chain and the 3D chain are to be developed further, so that the meshes and cases are written out automatically from LEP Studio. At present they run from scripts, not from Studio.
5. Closed and open 2D: the air intake
The real wing breathes through an air intake on the lower surface near the nose. In LEP's input (Section 2, the columns "intake in" and "intake out") the intake of the gnuA7 is the lower-surface part from 1.6 to 6.3 % of the chord on every rib. Ribs 1 to 14 are open and ribs 15 to 17 (the tip) are closed. On rib 1 this is a mouth 145 mm long, from 46.6 to 183.5 mm behind the nose, 72 to 121 mm below the chord line and tilted -19.5 degrees to the chord. In the terms of Belloc et al. (Int. J. Aerodynamics 5(2), 83-104, 2016, the air-inlet study of an open paraglider airfoil) the width is 4.9 % and the position 5.5 % of the lower-surface length. That is wider than his widest case (4 %) and slightly further back than his furthest (5.3 %); his best case was 1 % wide at 2 %.
The model (measured). The skin is a 1 mm thick solid with the inner face offset along the normal. The cavity reaches to 94 % chord and has a rounded end, because a flat end wall produced skewed cells. The lips are 1 mm thick. The reinforced edge of the real intake is at least that thick, so the lip end faces are physical and not an artefact. Separate patches for the outer faces, the inner faces, the lips and the cavity end make it possible to read the force on each. There are two meshes: op1 (261,584 cells, thick stack on the whole inner skin) and op2 (255,729 cells, thick stack only over the first 20 % of the chord inside and a thin 16-layer stack behind). Their forces agree within 0.1 % in lift and 0.4 % in drag (Figure 9).
Result at 9 degrees (measured, Figures 10 to 12). The total CL is 1.0666 and CD 0.01976 on op1, against 1.0635 and 0.01916 for the closed foil: +0.3 % lift and +3.1 % drag. With op2 and the finer closed reference of the later sweep the figures are +0.15 % and +3.4 %. On op2 the outer faces carry CL 1.0258 and the inner faces the rest (CL 0.0396, CD 0.0216), which is the pressure inside times the mouth area. The pressure inside is constant, Cp 0.913, equal to the outer pressure at the forward lip (0.915). The stagnation point sits at x/c 0.0097, just ahead of the mouth. On the closed foil the mean Cp across the gap would have been 0.779 and the maximum 0.965. The air moves slowly in vortices inside the cavity (below 0.2 of the free-stream speed). It enters over the front part of the mouth at a total pressure of about 0.99 and leaves near the aft lip. Behind the aft lip a separation bubble sits on the outside skin from 6.4 to 8.3 % chord. The Cp there dips to 0.11 and recovers to 0.55 at x/c 0.086. The bubble differs in size between op1 and op2 (the lip Cp is 0.27 against 0.12), so its detail depends on the mesh. The edge thickness of the lip, which is a parameter of the real material, probably sets its size (inferred, not tested). The external flow of the open foil is almost that of the closed foil. A check with Belloc's equation 5, which builds the open-foil force from the closed foil, shows the external flow changing little (CL -0.003, CD -0.002).
The pressure difference across the skin (inside minus outside, positive pushing the skin outwards) is 0.8 to 4.05 on the upper skin and 0.4 to 0.9 on the lower skin. The exception is a small inward push (-0.09) on the lower skin at x/c 0.006 to 0.016, just before the mouth (measured, Figure 12).
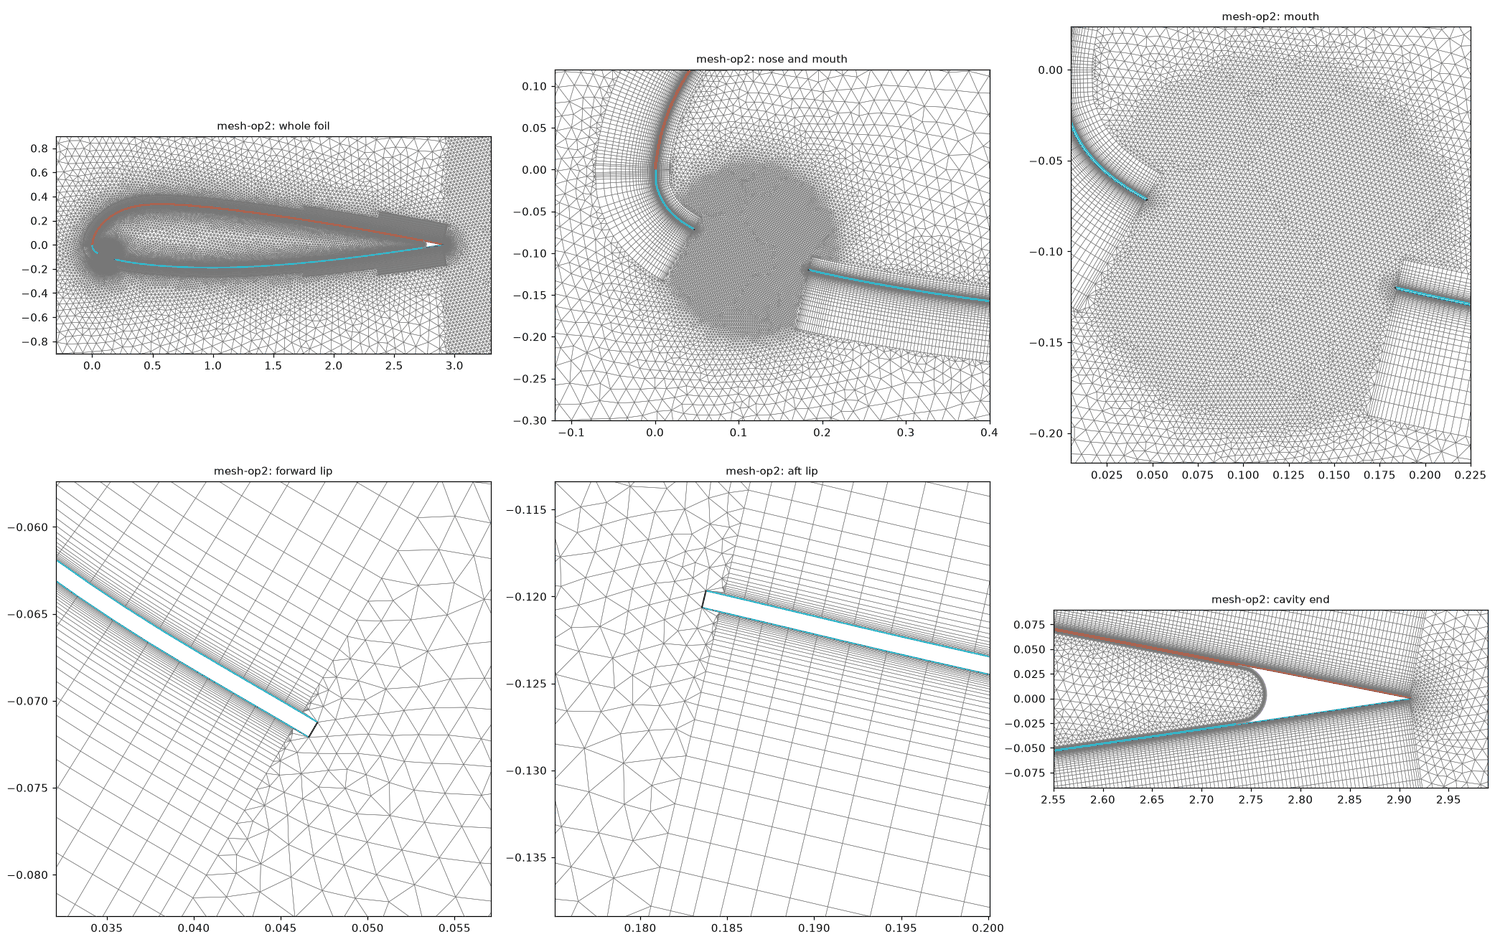
Figure 9. The mesh of the open foil (op2). Six windows. Top row, left to right: the whole foil (orange upper, blue lower skin, with the wake box at the right); the nose and the mouth; the mouth enlarged. Bottom row: the forward lip, the aft lip and the rounded cavity end near the trailing edge, drawn to scale. The skin is a 1 mm solid (the white strip in the lip windows) with its own boundary-layer stack on the outer face and on the inner face. The mouth is the gap between the two lips; the large round region inside is the cavity, meshed with fine triangles.
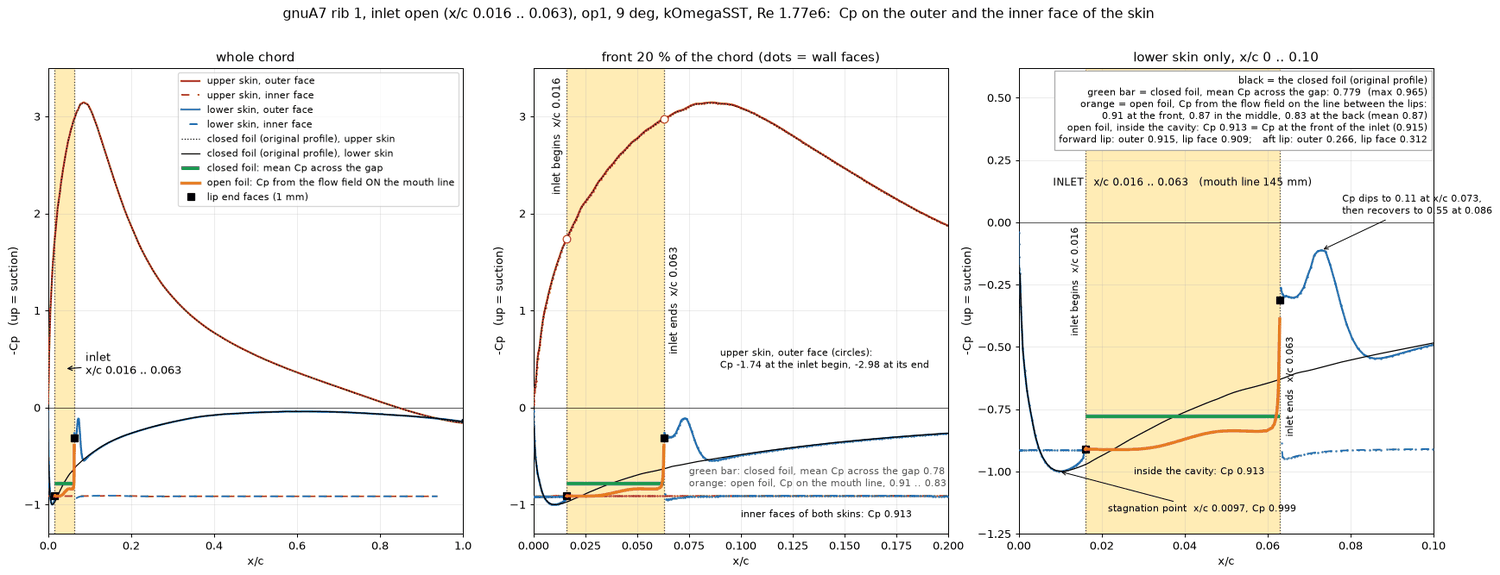
Figure 10. Pressure on the outer and inner faces of the skin (open foil, 9 degrees). Three views of -Cp against x/c (suction upwards): the whole chord, the front 20 % and the lower skin from 0 to 10 %. The yellow band is the intake (x/c 0.016 to 0.063). Solid lines are the outer faces (red upper, blue lower), dashed lines the inner faces: both are flat at Cp 0.913 (-Cp of -0.913). The thin black line is the closed foil. The green bar is the mean pressure the closed foil has across the gap (0.779); the orange line is the pressure of the flow on the mouth line (0.91 at the front, 0.83 at the back); black squares are the lip end faces. After the aft lip the lower skin shows the dip and recovery of the separation bubble. The annotations give the stagnation point (x/c 0.0097, Cp 0.999).
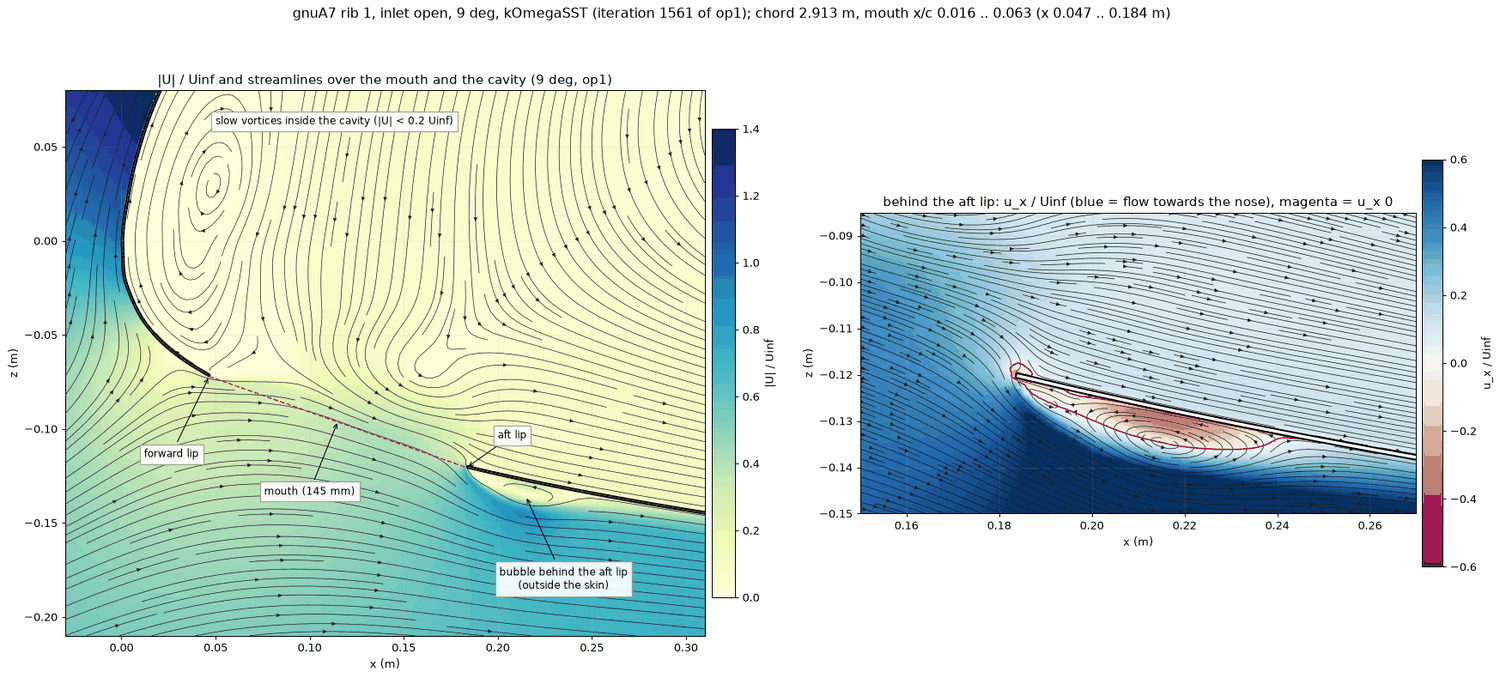
Figure 11. The flow in and around the mouth (open foil, 9 degrees). Left: speed relative to the free stream (colour, 0 to 1.4) with streamlines, over the mouth and the cavity. The forward lip, the aft lip and the 145 mm mouth (red dashed) are marked; the pale yellow region is the slow air in the cavity with two vortices, and the blue region below the aft lip is the bubble outside the skin. Right: an enlargement behind the aft lip showing the horizontal velocity relative to the free stream (blue towards the trailing edge, red towards the nose); the magenta line encloses the reversed-flow bubble.
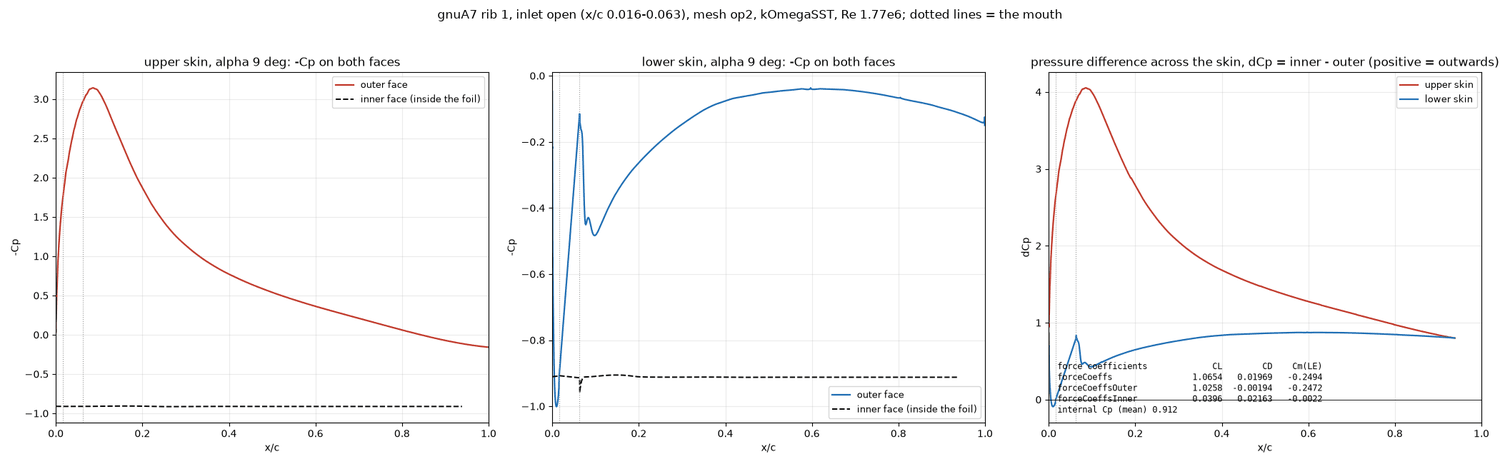
Figure 12. Pressure on both sides of the skin and the difference across it (open foil, 9 degrees). Left: upper skin, -Cp on the outer face (red) and the inner face (dashed black); middle: lower skin, same; right: the pressure-coefficient difference inside minus outside (red upper skin, blue lower skin; positive means outwards). The inner faces are at -Cp -0.9 everywhere; the difference is about 4 at the suction peak and 0.8 to 0.9 over most of the lower skin. The panel lists the forces: total CL 1.0654, outer faces 1.0258, inner faces 0.0396; internal Cp 0.912.
6. The internal pressure over the whole angle sweep
The open and the closed foil were run at 0, 3, 4, 6, 9, 10, 11, 12, 13, 14 and 15 degrees (measured). The 0, 3, 4, 6 and 15 degree runs stopped at the iteration cap of 1500. There the inner forces are flat to 1 to 2 %, and the total drag scatters by 4 to 10 % at 0 to 4 degrees.
| Angle (deg) | Cp inside the open foil | Closed foil: Cp at the front lip (x/c 0.016) | Inside / front lip | Inside / highest closed Cp across the gap | Stagnation point, open (x/c) | CD open against closed |
|---|---|---|---|---|---|---|
| 0 | -0.293 | -0.331 | 88 % | 86 % | -0.001 | +30 % |
| 3 | 0.209 | 0.328 | 64 % | 68 % | 0.000 | +21 % |
| 4 | 0.317 | 0.498 | 64 % | 66 % | 0.001 | +17 % |
| 6 | 0.601 | 0.764 | 79 % | 81 % | 0.003 | +11 % |
| 9 | 0.912 | 0.974 | 94 % | 94 % | 0.010 | +3.4 % |
| 10 | 0.964 | 0.995 | 97 % | 97 % | 0.012 | +2.6 % |
| 11 | 0.980 | 0.997 | 98 % | 98 % | 0.015 | +1.5 % |
| 12 | 0.995 | 0.981 | 101 % | 99.6 % | 0.016 | +0.5 % |
| 13 | 0.999 | 0.941 | 106 % | 99.9 % | 0.016 | +0.1 % |
| 14 | 1.000 | 0.902 | 111 % | 99.9 % | 0.089 | +0.5 % |
| 15 | 1.000 | 0.861 | 116 % | 100 % | 0.086 | +3.5 % |
What drives the pressure (measured, Figures 13 and 14):
- The cavity pressure rises from below the free-stream static pressure at 0 degrees (Cp -0.29) to the full stagnation pressure from 13 degrees (Cp within 0.001 of 1.000). It tracks the pressure that the closed foil has at the front lip, which is the stagnation pressure of the flow arriving at the mouth: from 9 to 12 degrees it is within 6 % of that value. As the angle grows, the stagnation point moves back along the lower surface (on the closed foil from x/c about 0 at 0 to 3 degrees to 0.032 at 15 degrees). The closed-foil pressure at the front lip peaks at 10 to 11 degrees (0.995 to 0.997) and then falls again as the stagnation point passes the lip.
- The open stagnation point follows the closed one until 13 degrees (x/c 0.016, the lip), then jumps to x/c 0.086 to 0.089 at 14 and 15 degrees. The whole mouth is then on the pressure side, and the cavity is filled to the stagnation pressure.
- At low angles the cavity is far from the stagnation pressure. The mouth lies on lower-surface flow that has already accelerated, and the cavity pressure settles between the static pressures along the mouth line (Figure 14). Through the mouth the flow is a mixture of in and out: 43 % of the mouth length takes air in at 0 degrees (with 57 % going out), 46 % at 3 degrees and 65 % at 9 degrees (35 % out). The total pressure along the mouth line is about 0.95 to 1.0 over most of the mouth at 9 degrees, 0.3 to 0.9 at 3 degrees and -0.4 to +0.5 at 0 degrees.
- The intake does not change the lift: CL open equals CL closed within 0.006 from 3 to 14 degrees (0.011 higher at 0 degrees, 1.3 % lower at 15 degrees). The drag penalty of the open mouth is large at low angle (+30 % at 0 degrees, +17 % at 4 degrees) and disappears from 11 degrees.
- The usual shortcut, "internal pressure as a share of the closed-foil pressure at the lip", holds only at 9 degrees. The share is 64 % at 3 to 4 degrees, 79 % at 6, 94 % at 9, and 106 to 116 % at 13 to 15 degrees. Taking the highest closed-foil Cp in the gap instead gives 66 to 68 %, 81 %, 94 % and 99.6 to 100 % at the same angles (measured). A model that takes the internal pressure as the full dynamic pressure at every angle agrees with the CFD only from about 12 degrees upward. At 9 degrees the CFD cavity is 9 % below that value and at 3 degrees 79 % below (inferred from these figures).
Limits (not done or open): the runs are steady 2D RANS for rib 1 only. There is no flow along the span between the cells of the real wing, no refinement study of the mouth mesh, and the low-angle mouth lines are wavy (9 degrees is smooth). The intake geometry was not changed in the CFD apart from the one LEP geometry. Only kOmegaSST was used; a Spalart-Allmaras run as in Belloc's study was not made. The seam height is not modelled: the cloth at the intake edge and at the seams is folded three or four times, its thickness is estimated by the author at about 1 mm and is not resolved, and the lip of the CFD is 1 mm.
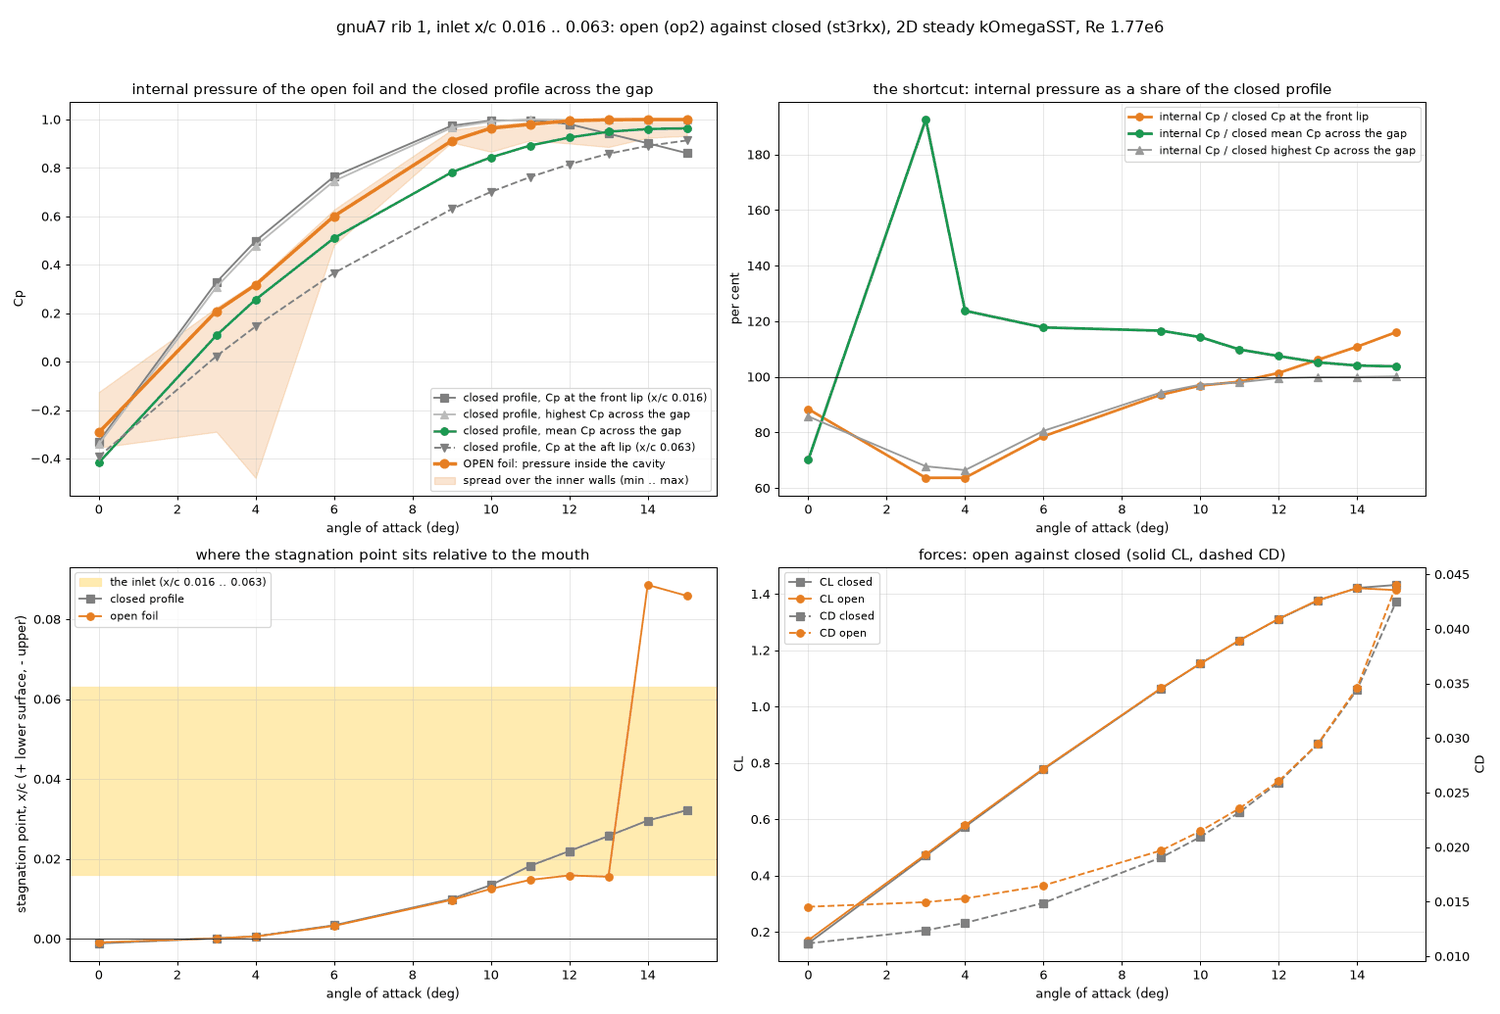
Figure 13. The internal pressure of the open foil against the angle of attack (open against closed). Top left: Cp against angle; the thick orange line is the pressure inside the cavity (the pale band is the spread over the inner walls), the grey lines are the closed-foil pressure at the front lip, the highest and the mean across the gap and at the aft lip. Top right: the internal pressure as a percentage of three closed-foil values (front lip orange, mean green, highest grey), showing how the shortcut changes with angle (100 % = equal). Bottom left: position of the stagnation point on the lower surface for the open (orange) and closed (grey) foil, with the yellow band marking the intake; at 14 degrees the open stagnation point jumps behind the mouth. Bottom right: lift (solid) and drag (dashed) of the open (orange) and closed (grey) foil; lift lies on top, drag is higher with the intake open at low angle.
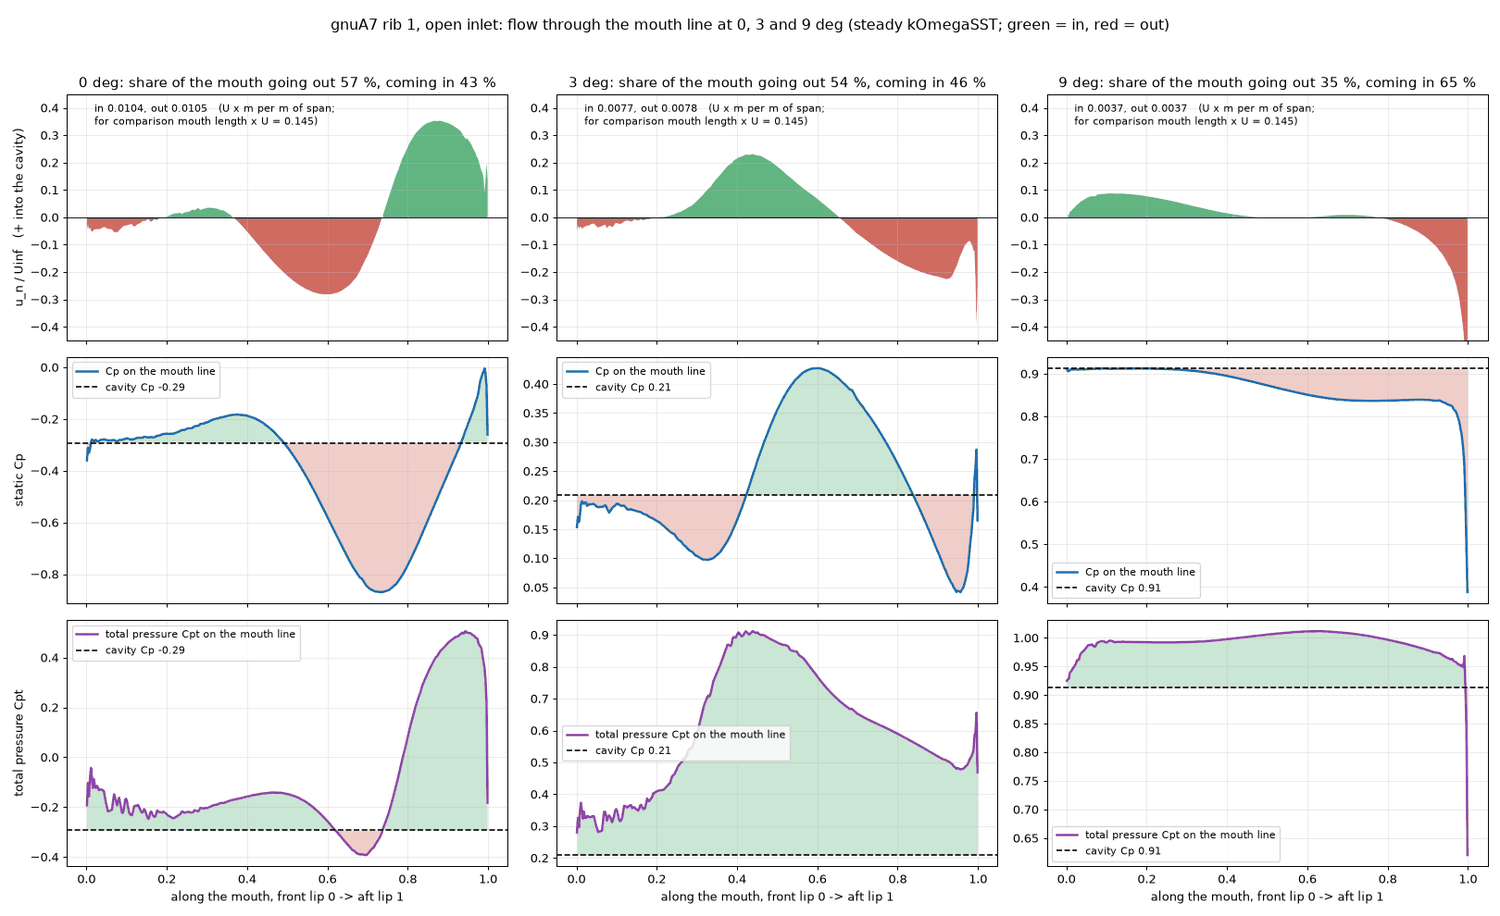
Figure 14. The flow through the mouth at 0, 3 and 9 degrees. Three columns, one angle each; the horizontal axis runs from the front lip (0) to the aft lip (1). Top row: speed normal to the mouth line, green into the cavity and red out of it (the share of the mouth going out is given above: 57 %, 54 % and 35 %). Middle row: static Cp on the mouth line (blue) against the cavity Cp (dashed black); where the mouth-line pressure is above the cavity pressure air flows in. Bottom row: total pressure on the mouth line (purple). At 9 degrees the mouth-line pressure is near the cavity pressure over the front half, at 0 and 3 degrees it varies strongly along the mouth and the in- and outflow regions swap places.
Where the nose is pushed in (measured, Figure 14b). Pressure arrows show it more plainly than Cp. At 0 degrees the air stagnates on the nose and pushes the skin inwards, while the cavity (Cp -0.29) pulls the skin outwards. The net pressure pushes the skin inwards from the nose tip to x/c 0.038 on the upper skin and to x/c 0.008 on the lower skin, by up to 1.3 q (about 66 Pa) at the tip. At 3 degrees the inward zone is shorter and weaker: up to 0.8 q (about 40 Pa), within x/c 0.010 on the upper skin and 0.015 on the lower skin. At 9 degrees the upper nose is pushed outwards everywhere (suction outside, Cp 0.91 inside), and the lower skin is pushed outwards except for a small inward push (0.09 q, about 5 Pa) at x/c 0.010 just before the mouth. The computation is steady and the skin is rigid. How far the nose of the real, soft canopy deforms is not computed (not done).
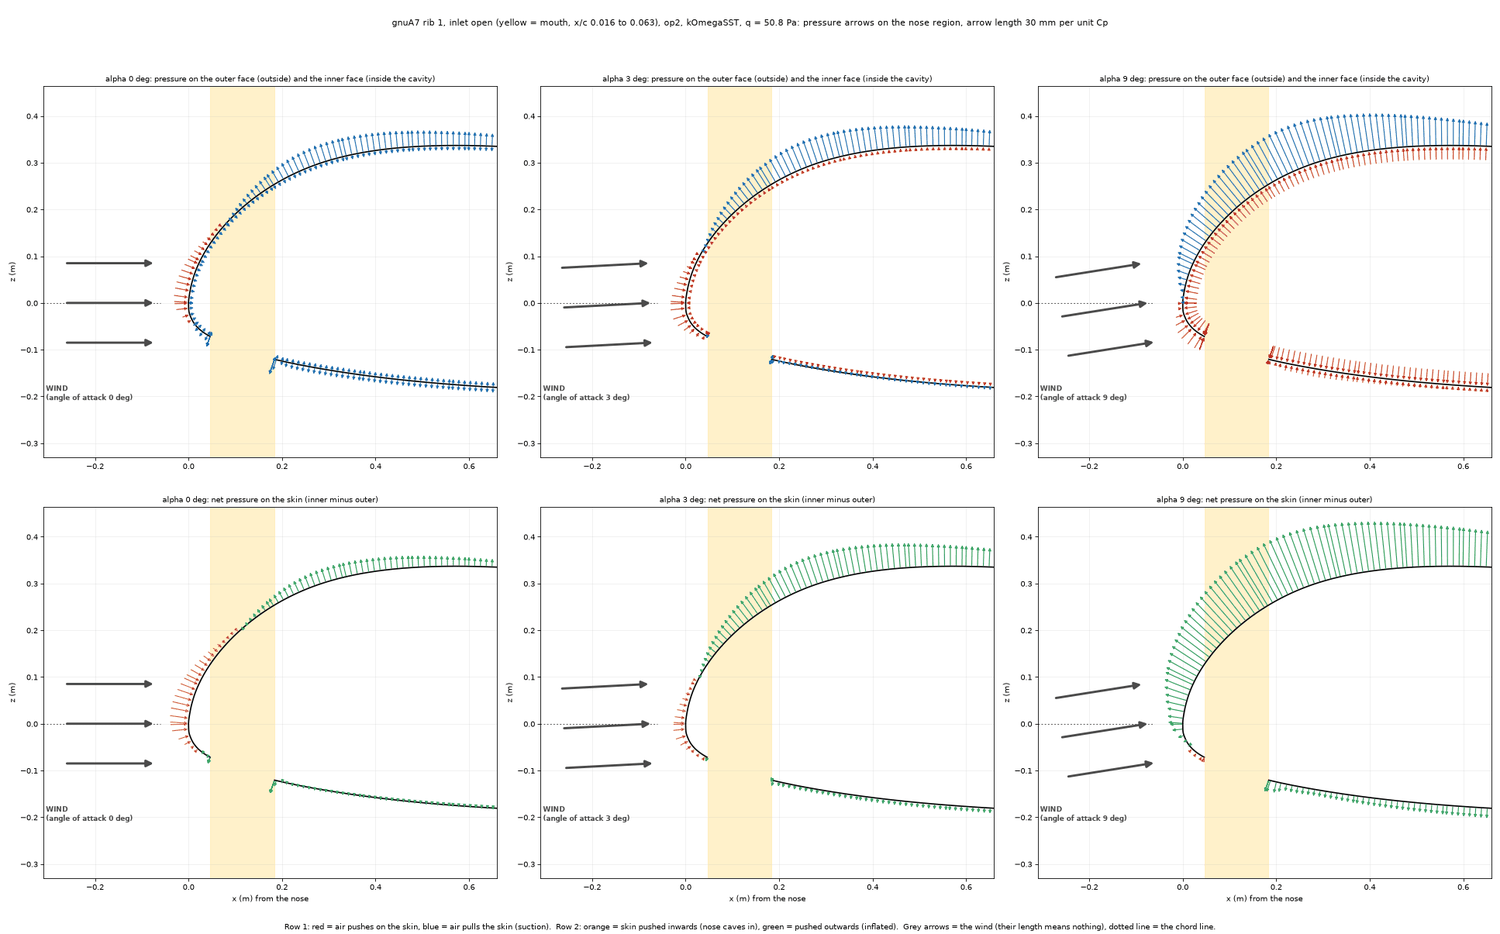
Figure 14b. Pressure arrows on the nose of the open foil at 0, 3 and 9 degrees (rib 1, mesh op2). One column per angle; the front of the profile (x from the nose to 0.66 m behind it, x/c 0 to 0.23, x and z in metres,same scale in both directions) with the skin as a black line and the mouth (x/c 0.016 to 0.063, the gap in the lower skin) in yellow. Top row: the pressure on both faces of the skin, one arrow every 12 mm along the skin, 30 mm long per unit of Cp; the arrows outside the skin belong to the outer face, the arrows inside the skin to the inner face (the cavity). A red arrow points at the skin (positive Cp: the air pushes on the skin), a blue arrow points away from it (negative Cp: suction pulls on the skin). Bottom row: the net pressure on the skin (inner face minus outer face, same length scale): an orange arrow points at the skin (net push inwards, the nose caves in), a green arrow points away (net push outwards, the skin is inflated). The three grey arrows in front of the nose are the wind: the foil is drawn with its chord horizontal at every angle, so the wind comes from the front and from below, tilted by the angle of attack from the dotted line (the chord line); their length has no meaning. At 0 degrees the stagnation pressure on the nose (red, outside) is larger than the cavity pressure and pushes the nose in; at 3 degrees the push is weaker; at 9 degrees the suction on the upper nose and the cavity pressure push the skin outwards. The arrows get longer with angle, not shorter: the lowest Cp on the upper skin is about -1.3 at 0 degrees, -1.9 at 3, -3.1 at 9 and -4.2 at 15 degrees. (A first version of this figure and of the animation drew these long suction arrows in a window that was too small, so they were cut off at the higher angles, and it stopped the arrows at 0.47 m behind the nose on the upper and the lower skin while the skin line went on; the window now contains every arrow and the arrows run to its right edge.) An animation of all the angles that were run (0 to 4, 6 and 9 to 15 degrees) is Figure 14c below; each frame also carries the close-up of the Cp curve on the lower skin (as in Figure 9, without the closed foil) with the orange mouth-line curve, the pressure inside the cavity and the stagnation point.
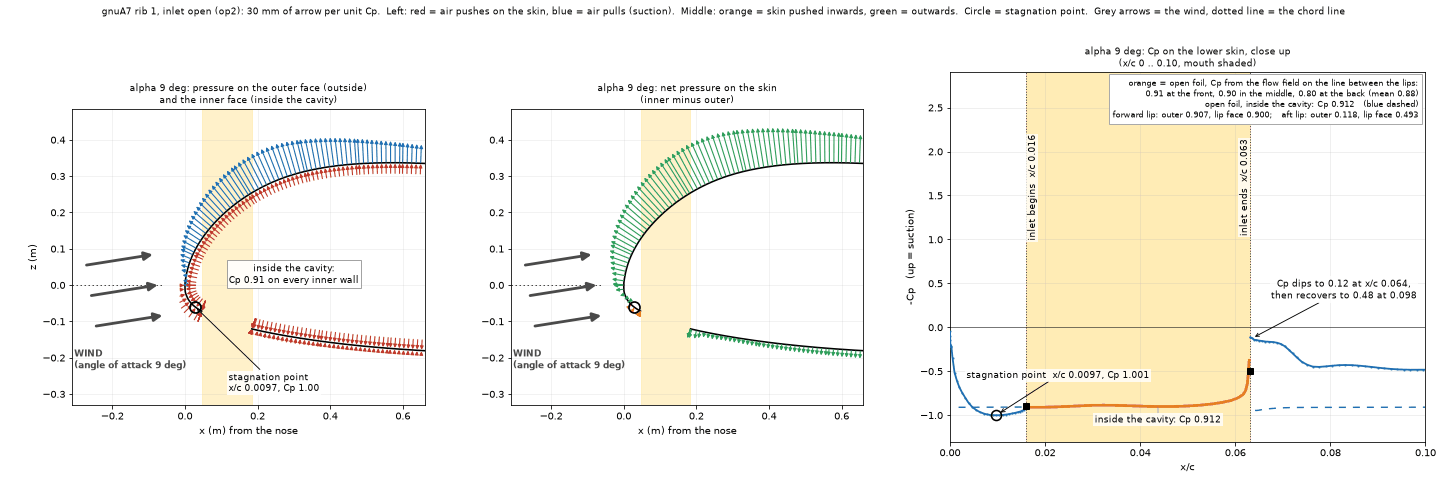

Figure 14c (slider). The same pressure arrows for every angle of attack that was run (rib 1, open air intake, mesh op2): 0 to 4, 6 and 9 to 15 degrees. Move the slider, press an angle or press Play. Left: arrows on the outer face (outside the skin) and the inner face (inside the cavity); red points at the skin (the air pushes), blue points away (suction); 30 mm of arrow per unit of Cp. Middle: the net pressure on the skin, inner face minus outer face; orange = pushed inwards (the nose caves in), green = pushed outwards. The circle is the stagnation point (the highest Cp on the outer face of the lower skin). The three grey arrows in front of the nose are the wind: the foil is drawn with its chord horizontal at every angle, so the wind comes from the front and from below, tilted by the angle of attack from the dotted line (the chord line); their length has no meaning. Right: the close-up of the Cp curve on the lower skin, x/c 0 to 0.10: blue = outer face, blue dashed = the inner face, orange = Cp from the flow field on the line between the two lips (black squares), shaded = the mouth; the numbers give the pressure inside the cavity, the stagnation point and the pressure at the lips. The arrows run along the skin to 0.66 m behind the nose. At 14 and 15 degrees the highest pressure on the lower skin lies behind the mouth, at x/c 0.086 to 0.089, below the pressure inside. The animated version of the same frames (0.9 s per frame) is the file images/skin-arrows-op2-sweep.gif in the package.
7. 3D: stacking and the billow valleys
7.1 What the 3D mesher can build
The 2D result calls for a stack thick enough to contain the boundary layer, or at least 40 to 60 mm. In 3D, snappyHexMesh with its default layer settings builds only 17 to 19 mm stacks reliably (measured, 13 November):
| 3D stack attempt (no billow) | Stack | Share of the skin that got the layers (upper / lower) | Comment |
|---|---|---|---|
| Band mesh | 8 mm | 98 % / 98 % | 3.40 million cells |
| wf1A | 17 mm (3 mm x 4, growth 1.25) | 96 % / 93 % | 2.01 million cells, y+ 38 |
| wf1B | 19 mm (1.5 mm x 6, growth 1.3) | about 95 % | 2.30 million cells, y+ 21 |
| Default settings, thicker | 34 to 48 mm | 10 to 38 % | |
| Default settings | 59 mm | 0.4 % | |
| Finer surface (7.8 mm) with 48 mm | 48 mm | 0.1 % | |
| Relaxed quality limits (T1, T2) | 47.7 mm | 20 % / 37 % and 18 % / 32 % | mesh poor (non-orthogonality 79 to 84 degrees) |
| U1: four outer iterations and no layer growth limit | 47.7 mm | 79.7 % / 76.7 % | 2.47 million cells, non-orthogonality up to 75 degrees, 5 failed checkMesh checks; the layer pass took 2.4 hours |
| U2: displacement shrinker, U3: first-and-relative final layer | 47.7 mm | 6 / 13 % and 1.7 % | failed |
| cfMesh (probed once) | 59 mm (62.5 mm wall cells) | 1,018 negative-volume cells, 10 failed checks: unusable |
In the U1 mesh the missing layers sit outboard of 1 m from the centre (inboard they are nearly complete). The shape of the 3D wing, with its swept and arched outer part, blocks the thick stack that the same mesher builds at 99.6 % on a 2.5D slab of a single rib (all stacks from 7.7 to 59.3 mm). Figures 15 and 16 show the difference.
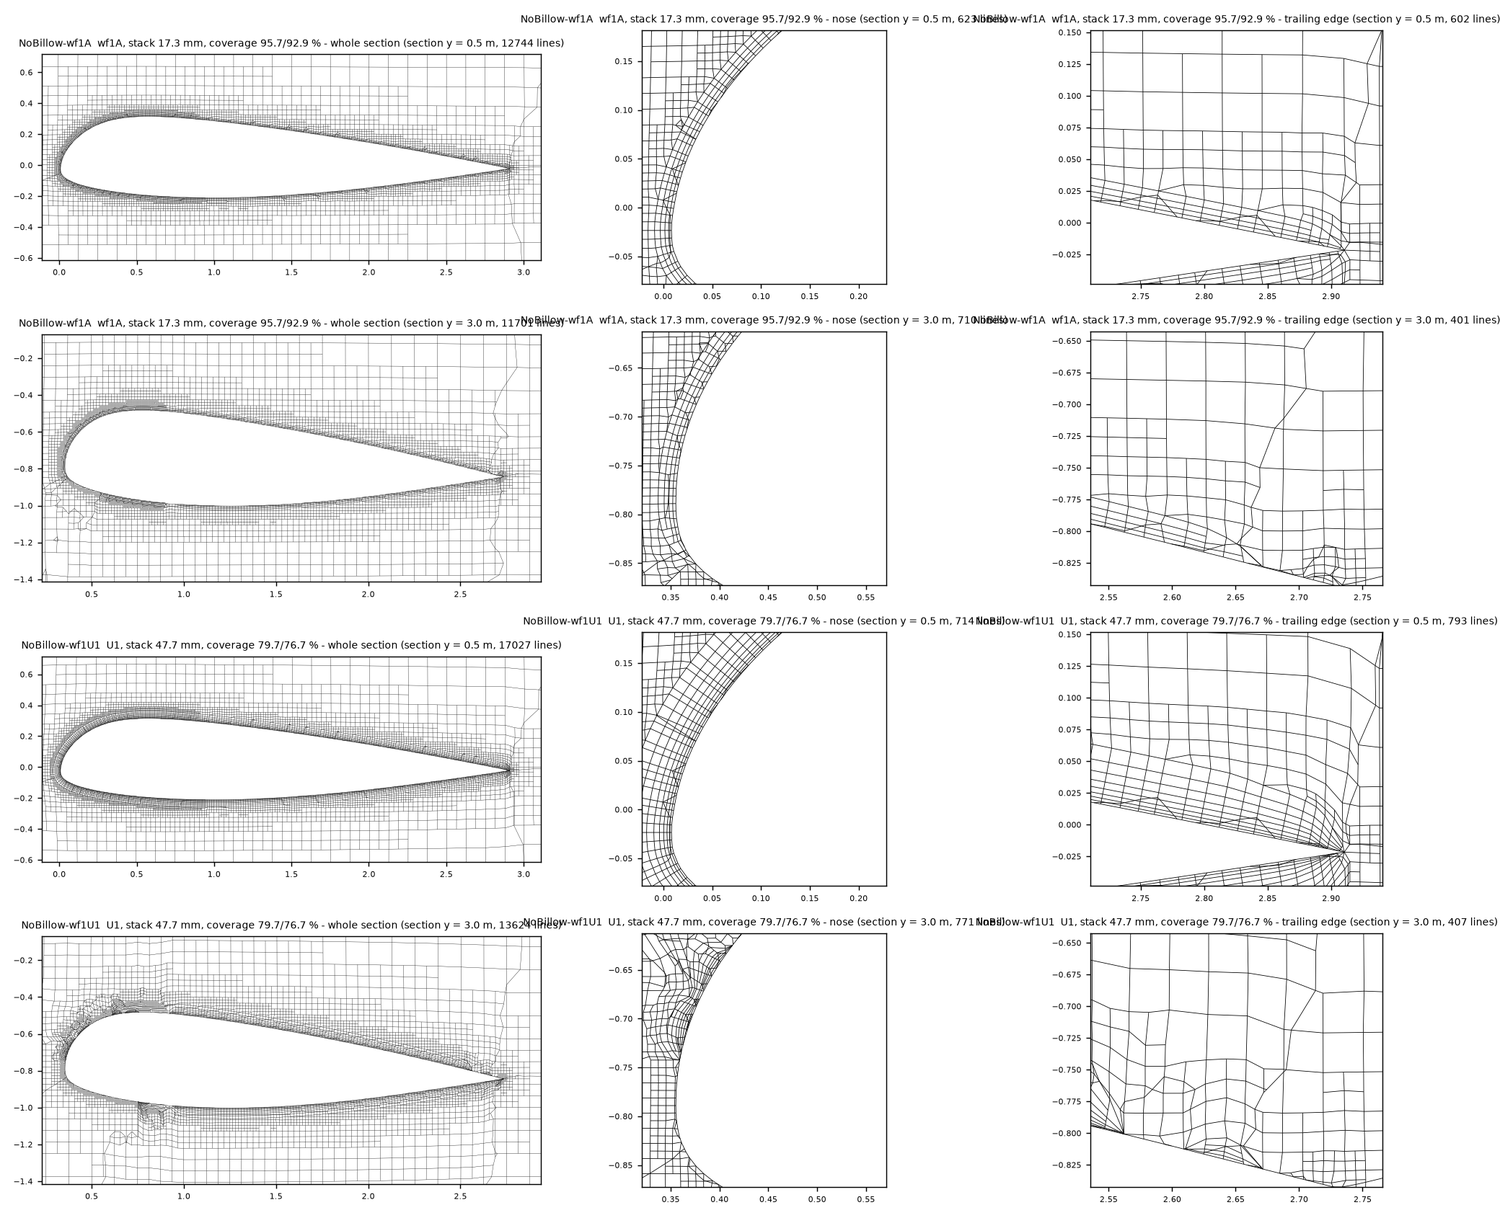
Figure 15. 3D meshes cut perpendicular to the span: 17 mm stack against 47.7 mm stack. Four rows, three columns each (whole section, nose, trailing edge). Rows 1 and 2: the 17 mm stack (coverage 95.7 / 92.9 %) at 0.5 m and 3.0 m from the centre. Rows 3 and 4: the 47.7 mm stack (coverage 79.7 / 76.7 %) at the same two places. At 0.5 m the layers form a clean band around the nose in both meshes. At 3.0 m the 47.7 mm stack is broken up at the nose (row 4, middle) and the layers are missing along part of the lower skin.
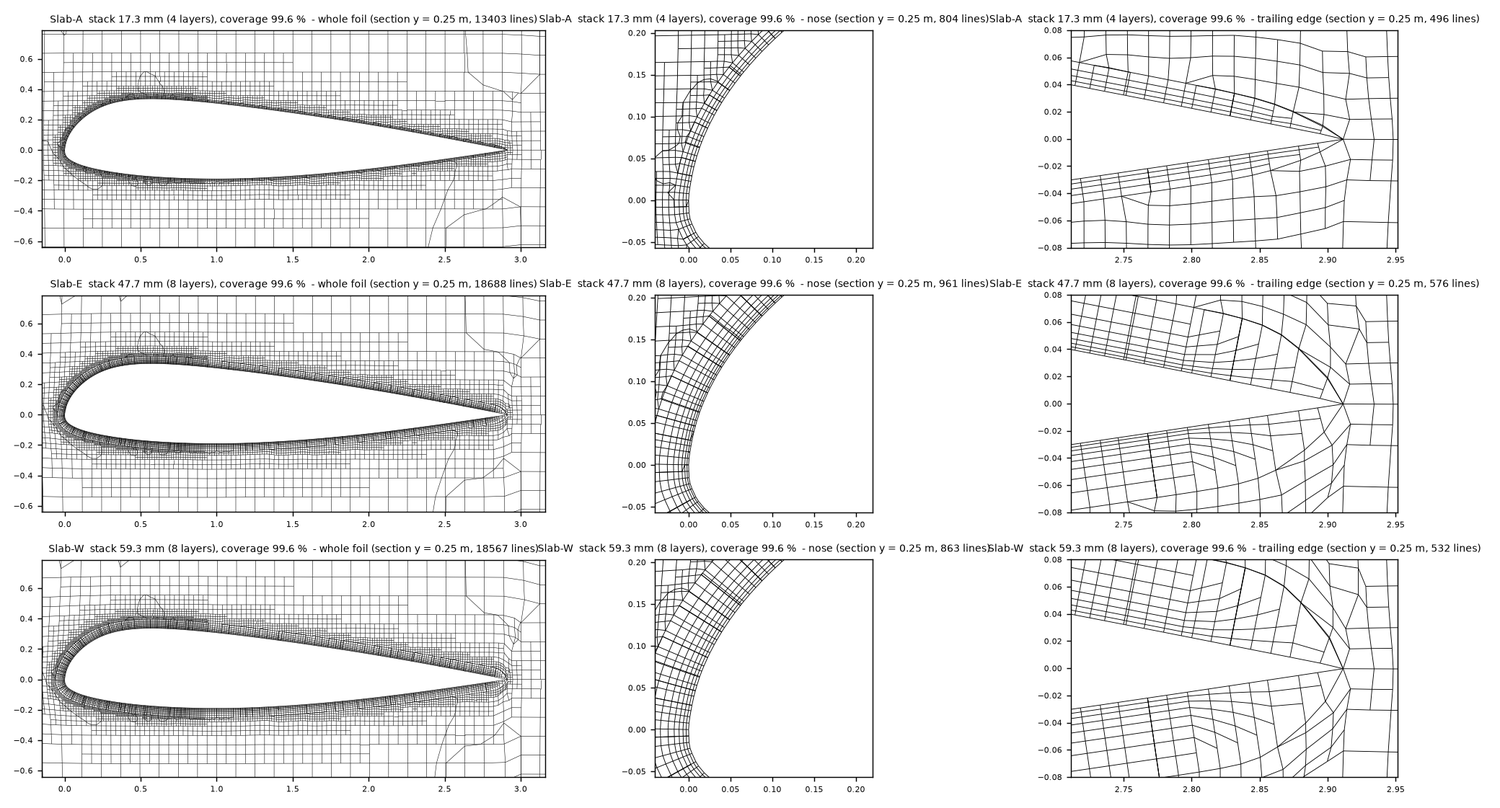
Figure 16. The 2.5D slab of rib 1 with three stacks (all 99.6 % covered). Rows: 17.3 mm (4 layers), 47.7 mm (8 layers) and 59.3 mm (8 layers); columns: the whole foil, the nose, the trailing edge. The mesher builds all three stacks around the nose and along both skins to the trailing edge, which indicates that the failures of Figure 15 are due to the shape of the 3D wing and not to the stack thickness itself (inferred).
7.2 The billow valleys
The billow adds creases (about 130 degrees included angle, a skin kink of about 50 degrees) that run along the flow between the ribs. They cause two problems for the mesh and one for the physics (measured).
- Layers collapse at the crease. With the 3 mm x 4-layer stack, the first billow mesh had no layers in a stripe of 5 cm on each side of every crease, on both skins. Only 65 % of the upper and 69 % of the lower skin faces were layered, and the thickness reached 75 % (upper) and 81 % (lower) of the target (Figure 17). Refining a band along the creases did not change this. The cause is the medial-axis rule of the layer addition. Where the surface folds into a concave crease, the allowed layer thickness is proportional to the distance to the medial axis, so a stack thicker than about 8 to 10 mm collapses (a six-layer stack produced 817 illegal faces). A thin stack (4 x 1.5 mm, growth 1.2, 7.7 mm) with a relaxed medial ratio and relaxed quality limits layers 97.8 % of the upper and 98.5 % of the lower skin faces. It was used for the whole billow sweep (3.17 million cells).
- Thick stacks fail at the crease even without the 3D wing shape. A 2.5D slab with one panel 0.36 m wide and a crease in the middle shows the same. It was built from the real section and the billow height measured from Studio's surface: the arc height between two ribs is 41 to 52 mm on the upper skin, 50 mm over x = 0.35 to 1.75 m and 13 mm at x = 2.85 m; on the lower skin it is 8 mm at x = 0.05 m, growing to 46 mm by x = 1.1 m; the rib spacing is 0.34 to 0.36 m near the root. With the refinement band, the 8 mm stack is 98.9 % / 98.3 % covered, the 17 mm stack 65 % and the 47.7 mm stack 1 %. Without the band, 8 mm gives 99.7 %, 17 mm 84 %, and 47.7 and 59 mm below 1.2 % (Figure 19). The crease alone stops thick stacks.
- The boundary layer in the valley is thicker, so a thin stack matters most there. At x = 1.0 m on the upper skin (Figure 18) the boundary-layer thickness (95 % of free-stream speed) is 15 to 23 mm on the crowns and 36 to 59 mm in the three grooves and on their shoulders. In the grooves the air next to the skin is slow: from the profiles of Figure 18, 0.05 of the free-stream speed at the wall and 0.8 only at about 20 mm, against about 10 mm on the crowns. With the thin stack the groove boundary layer lies on prism layers (cell centres at 0.7, 2.4, 4.4 and 6.8 mm), but these cover only about 8 mm of a 36 to 59 mm layer, so the valley flow is not resolved.
What the billow does to the section lift (measured): the billowed slab with the 8 mm stack oscillates by +-1.6 % and was stopped by hand at CL 0.870 and CD 0.0380, against 1.0710 and 0.0247 for the smooth twin. That is -18.8 % in lift. The cross-flow angle on the skin of the 3D billow wing is 3.4 degrees (median) inboard and 11 to 14 degrees outboard, the same as without billow (the arch), so the slab assumption of flow along the grooves was kept (inferred as good enough). A fully resolved billow valley, with a stack thick enough for the 36 to 59 mm layer, does not exist: this is not solved. The billow mesh is not yet satisfactory, and which method is best for the valleys is not decided. What snappyHexMesh and OpenFOAM can build and solve in a crease is limited (Figures 17, 18 and 19).
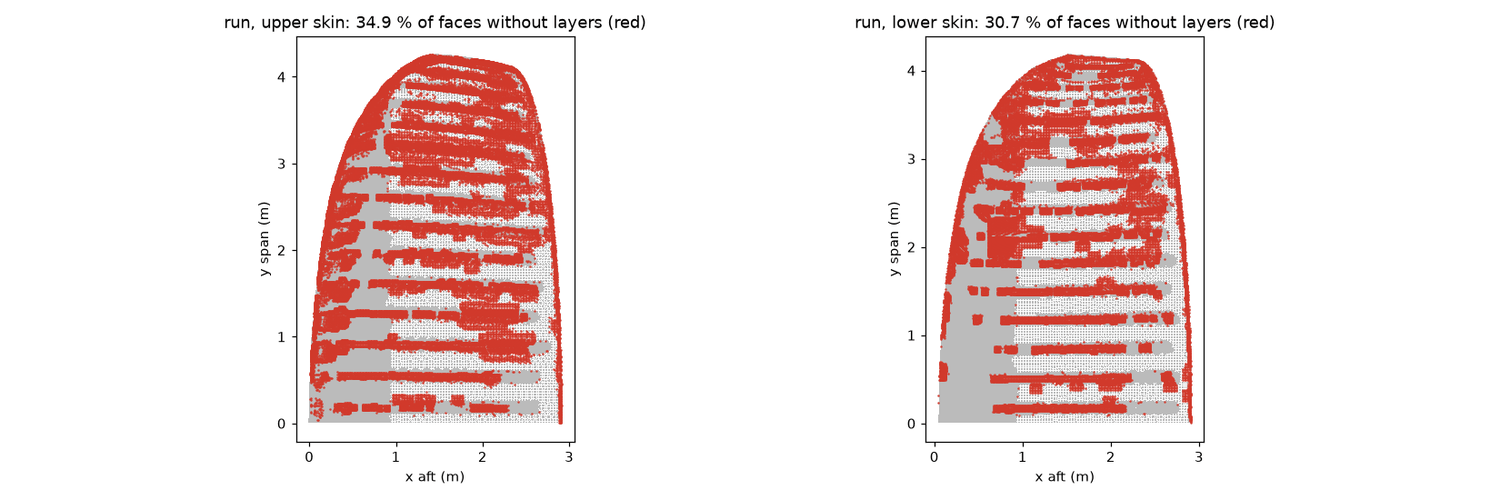
Figure 17. Where the first billow mesh has no layers. The wing seen from above (x aft, y along the span; nose on the left) with the skin faces that have no prism layers painted red: left the upper skin (34.9 % of the faces without layers), right the lower skin (30.7 %). The red stripes run along the rib creases from the nose to the trailing edge; the grey patches near the nose are layered. This is the mesh with the refined band and the 3 mm x 4-layer stack, before the thin stack was introduced.
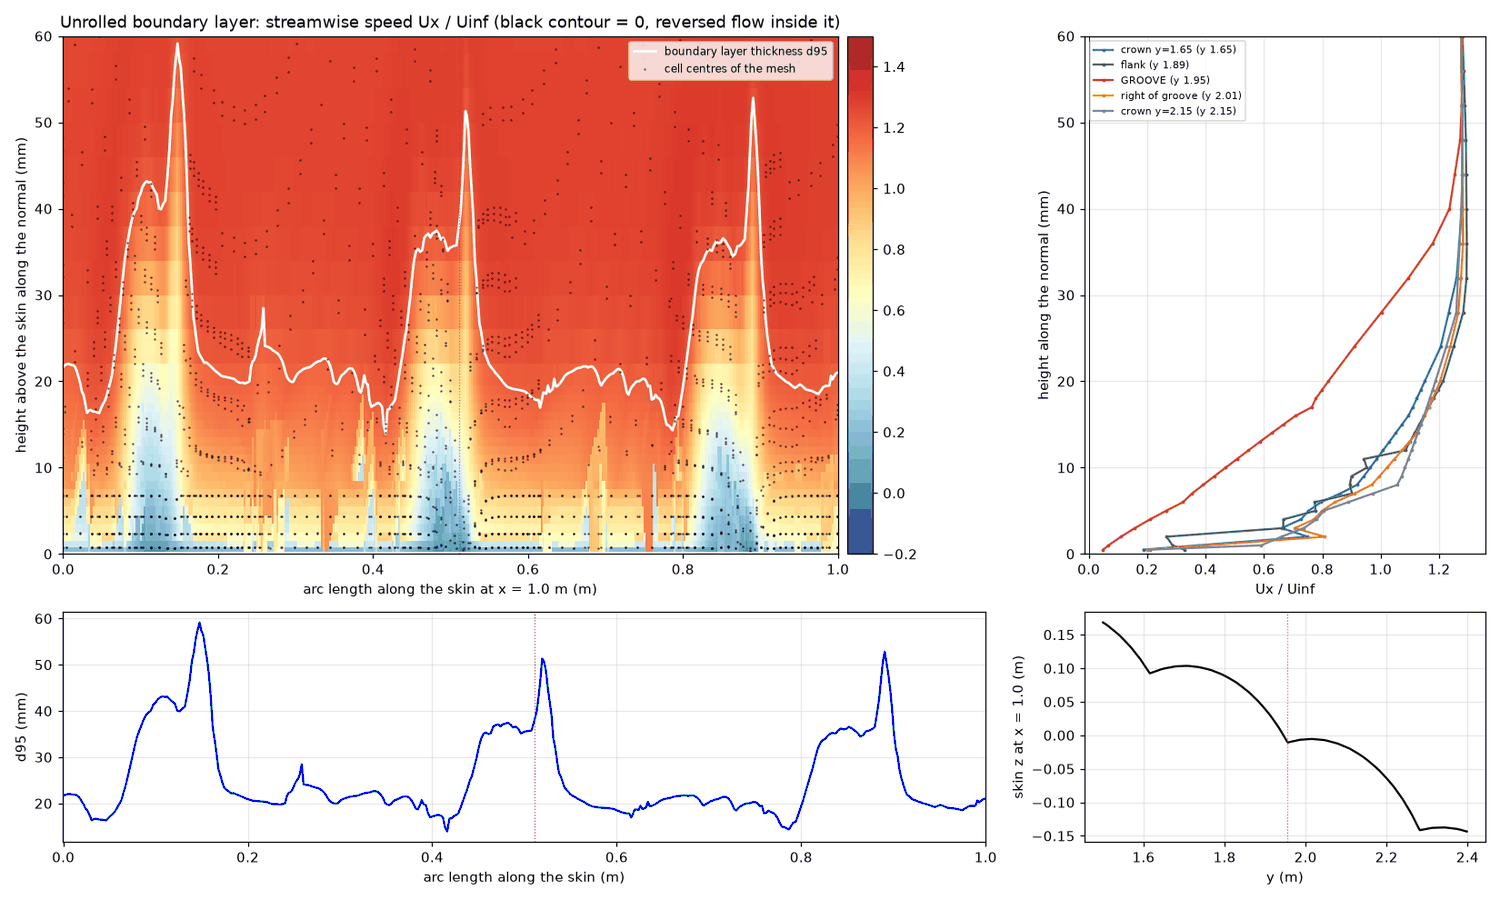
Figure 18. The boundary layer across three grooves (billow, band mesh, upper skin, x = 1.0 m). Top left: the skin unrolled along the arc length (horizontal, 0 to 1 m) and the height above it (vertical, 0 to 60 mm); colour is the speed along the flow relative to the free stream (blue is slow, red is fast), the white line is the boundary-layer thickness, the black dots are mesh cell centres (rows of dots near the wall are the prism layers). Top right: speed profiles at five stations (the groove in red, the crowns and the flanks in other colours); the groove profile is much fuller of slow air. Bottom left: the boundary-layer thickness along the arc length: 15 to 23 mm on the crowns and peaks of 51 to 59 mm at the three grooves. Bottom right: the shape of the skin in the plane x = 1.0 m with the groove marked.
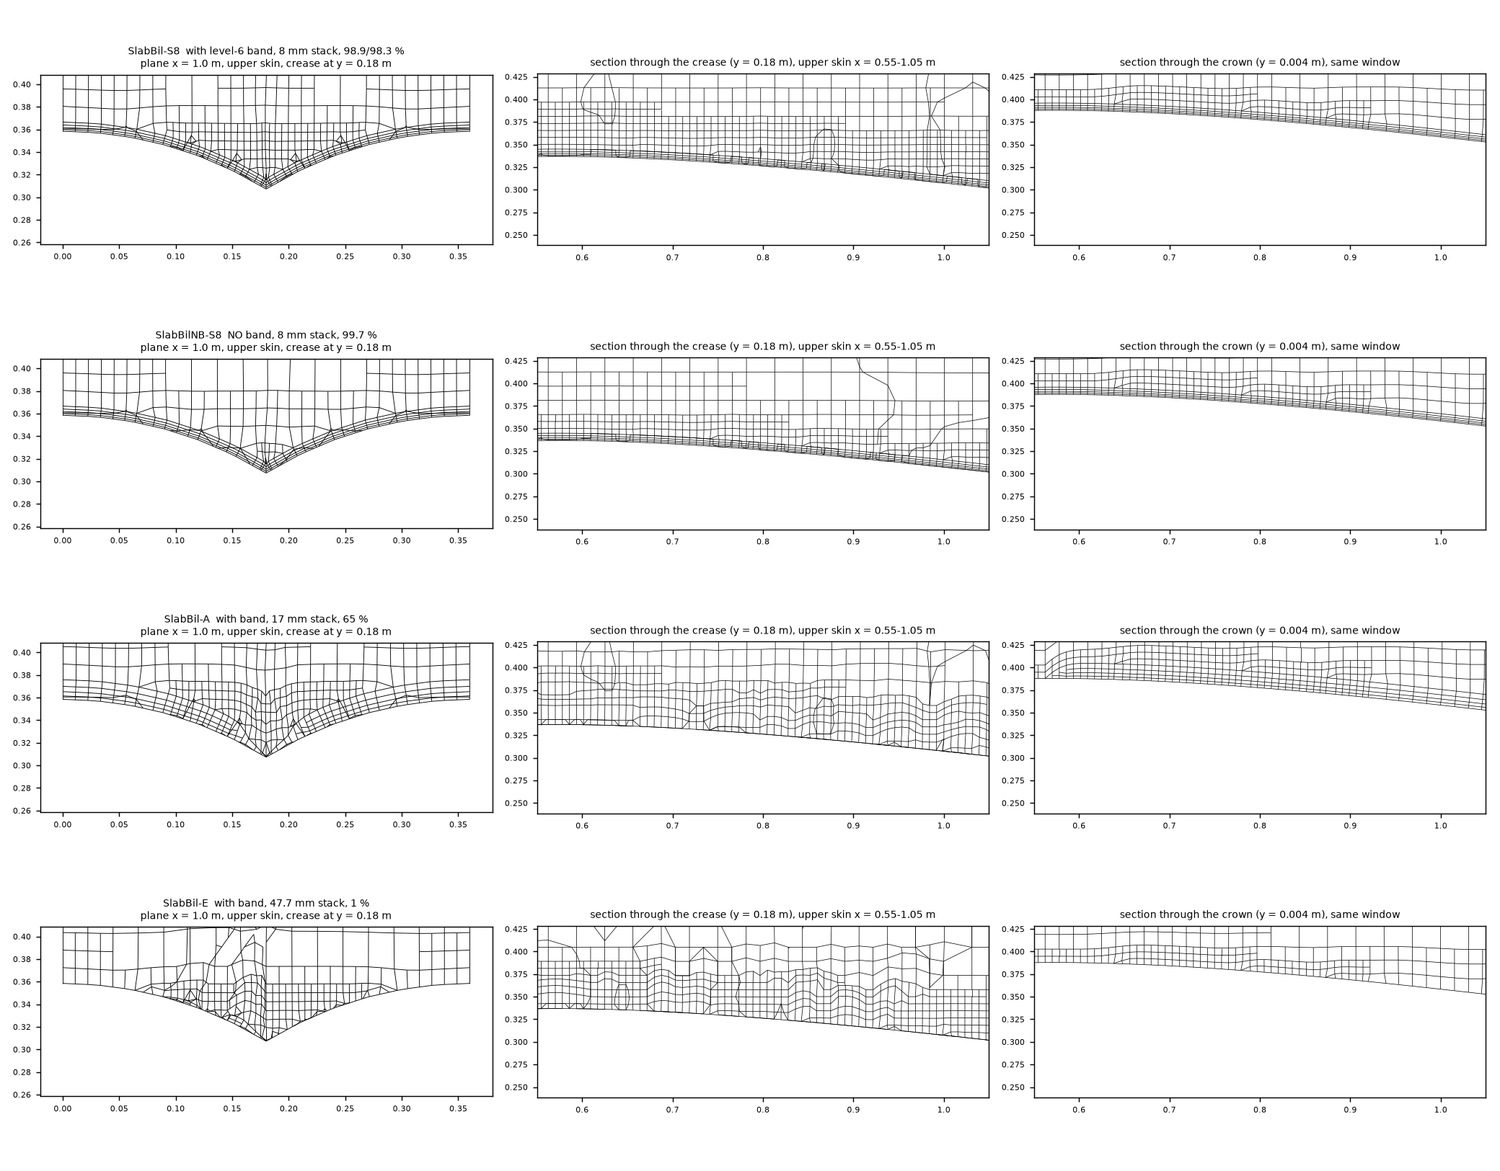
Figure 19. Layers in the billow slab (four variants). Rows: 8 mm stack with the refinement band (98.9 / 98.3 %); 8 mm stack without the band (99.7 %); 17 mm stack with the band (65 %); 47.7 mm stack with the band (1 %). Columns: a cut across the flow at x = 1.0 m with the crease in the middle; a cut along the flow through the crease; a cut along the flow through the crown (the middle of a panel). The 8 mm stack follows the V-shaped crease; the 17 mm stack fills the crease with distorted cells; the 47.7 mm stack has almost no layers there, while the crown (right column) keeps a clean layer stack in every case.
7.3 What the 3D sweep shows, and what it does not
The no-billow wing was run from 3 to 15 degrees with three stacks: 8 mm at 3 to 15 degrees, and 17 mm and 47.7 mm at 3, 5, 7, 9, 11, 13 and 15 degrees (measured, Figure 20). The three stacks agree within 0.7 to 0.9 % in CL and 1 to 2.7 % in CD at every angle (CL at 15 degrees 0.899, 0.899 and 0.893). The lift slope between 3 and 11 degrees is 3.10, 3.12 and 3.08 per radian. The 17 mm run at 15 degrees did not converge: the plateau of iterations 100 to 300 is plotted (CL 0.899, CD 0.0945), and later the drag creeps up and unsteady separation sets in. The 8 and 48 mm runs at 15 degrees converged.
Against the other results at 9 degrees:
| 9 degrees, no billow | CL | CD | CL/CD | Cm about the common point |
|---|---|---|---|---|
| 3D OpenFOAM, 8 / 17 / 47.7 mm | 0.600 / 0.601 / 0.595 | 0.0481 / 0.0483 / 0.0476 | 12.5 / 12.4 / 12.5 | +0.002 / +0.002 / +0.004 |
| 3D Flow5 | 0.711 | 0.0565 | 12.6 | -0.028 |
| Lifting line from the resolved 2D polar | 0.628 | 0.0512 | 12.3 | |
| Lifting line from the 2D polar with 8 / 17 / 47.7 mm stack | 0.589 / 0.600 / 0.614 | 0.0508 / 0.0513 / 0.0521 | 11.6 / 11.7 / 11.8 | |
| 2D rib 1 closed, resolved | 1.064 | 0.0190 | 55.9 | +0.015 |
| 2D rib 1 open intake (op2) | 1.065 | 0.0197 | 54.1 | +0.014 |
| 2D closed, 8 / 17 / 47.7 mm stack | 0.982 / 1.014 / 1.050 | 0.0224 / 0.0213 / 0.0200 | 43.9 / 47.6 / 52.5 | |
| Flow5 profile rib 1 (XFoil, trip 2 % / free) | 1.030 / 1.146 | 0.0162 / 0.0110 | 63.6 / 104.2 | +0.029 / +0.009 |
All pitching moments are about one point: a quarter of the rib-1 chord, 0.728 m behind the nose of the root rib, nose-up positive. CFD and Flow5 both use the nose of the root rib as the origin. The surface integrals reproduce the CFD moment exactly and the Flow5 moment to within 2 %. The 3D centre of pressure of the CFD stays at about the quarter chord of the root rib at every angle (Cm 0.000 to 0.006), while Flow5 moves from -0.014 to -0.033. The sign of the Flow5 moment is not an error, since both the wing and the profile are negative about the leading edge and the profiles are positive only about the quarter chord. Flow5's sections carry almost no nose-up moment (inferred: potential-flow panel pressures).
The unexplained point (measured, cause not established). In 2D the thin stacks lose 7.6, 4.6 and 1.3 % of the lift (8, 17, 47.7 mm). A lifting line built from those 2D polars predicts that the 3D lift should rise by 4 % from the 8 mm to the 47.7 mm stack. The 3D CFD shows -0.8 %. The 47.7 mm stack is only 77 to 80 % built and is missing outboard, so it may not be a thick stack in the sense of the 2D test. The 3D wing may also respond differently. None of this was tested. By the 2D analogy the 3D CL could be 2 to 5 % low and the CD 5 to 12 % high with the 17 mm stack (inferred, not tested in 3D). The 3D numbers are therefore repeatable (three meshes within 0.9 %) but not confirmed as accurate. The lifting line from the resolved 2D polar (no twist) follows the CFD curves within a few per cent from 3 to 14 degrees (ratio to the CFD 1.09 at 3 degrees to 1.02), and the Flow5 lift slope is 20 % above all of them.
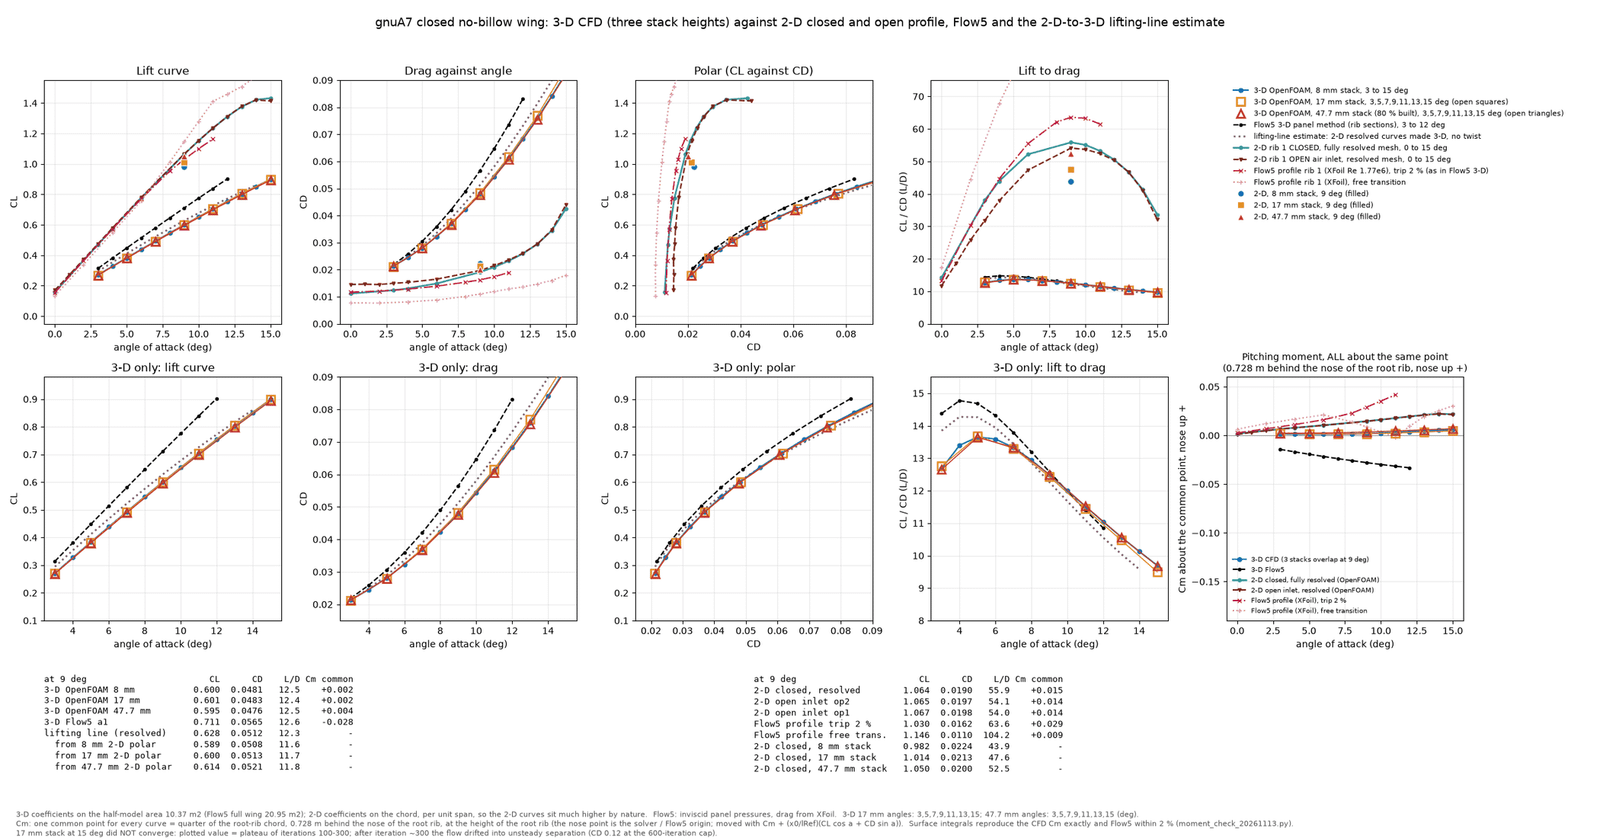
Figure 20. The 3D sweep against the 2D profile, Flow5 and the lifting-line estimate. Top row: lift curve, drag, polar and lift-to-drag ratio with everything on one scale. The upper group of curves (CL up to 1.4) is 2D per unit span: teal closed foil, dark brown open intake, pink XFoil profile (Flow5's polar) with trip at 2 % and free transition, plus the three 2D stack points at 9 degrees (blue circle 8 mm, orange square 17 mm, red triangle 47.7 mm). The lower group is the 3D wing: blue and orange and red markers for the three stacks (they lie on top of each other), black dashed for Flow5 3D, purple dotted for the lifting-line estimate. Bottom row: the same 3D curves enlarged (lift, drag, polar, lift to drag) and, at the right, the pitching moment for all curves about the common point. The two tables below the plots give the 9-degree values. The 3D stack curves coincide, while the three 2D stack points are spread apart.
8. The 3D pressures in the Playground, compared with the earlier report
The Playground is Studio's model of the whole wing under load (dynamics, loading, trim). It takes the pressure on every cell from a file. This section writes such a file from the 3D OpenFOAM billow sweep (8.1), shows the Flow5 flights of the earlier report (Lep Studio test on gnuA7 (24 m2), 29 October 2026) as the reference (8.2), and flies the wing in the Playground with the OpenFOAM pressures at 8, 9 and 10 degrees by changing the calage (8.3). Sections 8.4 and 8.5 explain why the OpenFOAM wing flies faster than the Flow5 wing and give the forces of the flights and the position of the plumb point against the centre of pressure. Section 8.6 lists what still differs between the OpenFOAM wing, the Playground wing and the real wing.
8.1 The pressure file and the loads the Playground adds
The billow sweep (3 to 14 degrees, section 7.2) was converted into the Playground's pressure file. For every cell of the wing, for the upper and the lower skin and for 40 chordwise bins, it holds the area-weighted mean Cp of the CFD surface faces that fall in the bin (measured). The Playground reads the file at the chordwise position (x/c) of each of its own triangles, linearly between the bin centres, and applies the force -q Cp times the area vector of the triangle.
The OpenFOAM pressure file is a closed wing. The Playground adds the viscous shear drag of the CFD (CDv times q times S, 14 N at 9 degrees), the drag of the open intake, the drag of the lines and the drag of the pilot (0.5 times air density times 0.35 m2 times V squared). The intake drag is a separate term from the 2D study of rib 1 (section 5): the difference in drag coefficient between the open and the closed foil at the same angle, kOmegaSST, from 3 to 15 degrees (+0.0034 at 0 degrees, +0.00065 at 9, +0.00004 at 13, +0.0015 at 15). It is read for every cell at the angle of the section of that cell in the flown wing, multiplied by the dynamic pressure and the planform area of the cell, and put on the mouth faces of the cell along the wind. Cells without a mouth get nothing. In the flights the term is 0.9 to 2.0 N for the whole wing (1 to 3 % of the wing drag). The real trailing edge (section 10) is in neither the OpenFOAM file nor the Playground. An allowance of 1 to 2 % of the wing drag is expected to be missing. The Playground has an adjustable term for it, which is set to zero in all flights.
8.2 The Flow5 flights of the earlier report (the reference)
The earlier report flew two designs of the gnuA7 in the Playground with a pressure file written from Flow5. They are the reference for the comparison in section 8.3. B2 has the design values glide ratio 6.499, plumb point 34.24 % and calage 33.23 % (Section 8 of the design file). B3 is the same design with the calage lowered by 4.13 percentage points of the central chord (plumb point 30.11 %, calage 29.10 %). The values are the settled states of the Flow5 flights of that report (mean of the last 2 s of 15 s flights; lift and drag from its history files), once without and once with FSI (3 cycles). K is the calage the wing settles at. The angle is the angle of the wing; the angle to the central chord line is 0.48 degrees higher.
| Settled flight state | K (%) | Speed (m/s) | Angle (deg) | Lift (N) | Drag (N) | L/D |
|---|---|---|---|---|---|---|
| B2: design calage 33.23 % (glide ratio 6.5, plumb point 34.24 %) | ||||||
| Flow5 pressure file b2, no FSI (earlier report) | 37.15 | 9.11 | 9.87 | 817.5 | 136.1 | 6.01 |
| Flow5, with FSI, 3 cycles (earlier report) | 37.18 | 10.27 | 7.86 | 820.7 | 113.9 | 7.20 |
| B3: design calage 29.10 % (the same design lowered by 4.13 points) | ||||||
| Flow5 pressure file b2, no FSI (earlier report) | 33.04 | 9.63 | 8.60 | 817.7 | 137.3 | 5.96 |
| Flow5, with FSI, 3 cycles (earlier report) | 33.21 | 10.89 | 6.79 | 820.1 | 118.4 | 6.93 |
8.3 Flying the gnuA7 at 8, 9 and 10 degrees by the design calage
With the OpenFOAM pressure file and the separate terms of section 8.1, the wing was flown at 8, 9 and 10 degrees by changing the calage of the design (Section 8 of the design file). The plumb point is moved with it and the lines are laid out again; the risers are not adjusted. Every flight starts from the design shape and runs 15 s of simulated time (900 frames, damping 10, the engine export of the design, closed mouth, no riser adjustment, cde 1.0 so that the intake is only the term of section 8.1). The values are the means of the last second. The wing is still creeping by 0.01 to 0.04 degrees per second at the end, so the settled angles are good to about 0.1 degree. The wing angle is the mean angle of all ribs. The central-chord angle is the angle of the chord of the central cell, which is the angle of the CFD, and the OpenFOAM values are read at the central-chord angle. K is the calage the wing settles at. The Cm = 0 point of the closed wing is the centre of pressure of the OpenFOAM force alone (pressure and friction, from the solver totals at the flown angle, measured about the nose of the central chord, positive nose-up: x = -Cm times the reference length divided by the force normal to the chord). The plumb point is where the vertical through the pilot meets the central chord (from the flown state).
| Flight | Design calage (%) | Wing angle (deg) | Central-chord angle (deg) | K (%) | Speed (m/s) | Lift / drag (N) | L/D | Plumb point (% chord) | Cm = 0 point of the closed wing (% chord) |
|---|---|---|---|---|---|---|---|---|---|
| C13-r4 | 13 | 8.00 | 7.91 | 26.5 | 11.59 | 817 / 142.2 | 5.75 | 34.4 | 20.4 |
| C20-r4 | 20 | 9.11 | 9.06 | 31.3 | 10.96 | 817 / 136.1 | 6.00 | 32.9 | 20.8 |
| C24p8-r5 | 24.8 | 9.99 | 9.98 | 34.9 | 10.54 | 816 / 133.0 | 6.14 | 32.1 | 21.1 |
| C26-r4 | 26 | 10.28 | 10.28 | 35.9 | 10.42 | 816 / 132.5 | 6.16 | 31.8 | 21.1 |
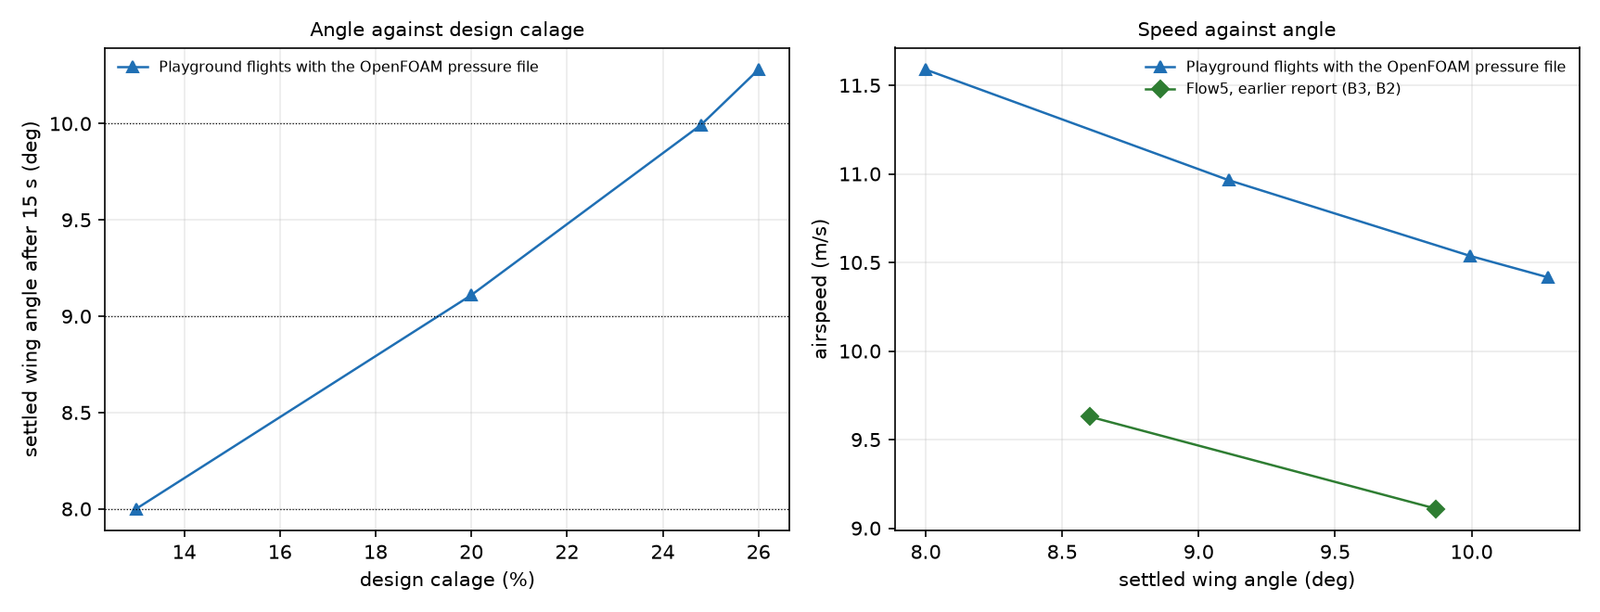
Figure 21. Settled angle against the design calage (left) and airspeed against angle (right). Left: the wing angle after 15 s for the flights of the table above; the dotted lines are 8, 9 and 10 degrees. Right: airspeed against wing angle; the green line is the Flow5 flights of the earlier report (B3 and B2, calage 29.10 and 33.23 %).
The final flights (measured). The design calage that gives 8, 9 and 10 degrees is 13, 20 and 24.8 % of the central chord (flights C13-r4, C20-r4 and C24p8-r5). The wing flies at 8.00, 9.11 and 9.99 degrees (central chord 7.91, 9.06 and 9.98), at 11.59, 10.96 and 10.54 m/s, with a glide ratio of 5.75, 6.00 and 6.14 (lift about 817 N, the weight of the wing and the pilot). The calage that gives a wing angle of 9 degrees is about 20 %, against about 30.4 % for the Flow5 flights of the earlier report (interpolated between B3 at 8.60 degrees with calage 29.10 % and B2 at 9.87 degrees with 33.23 %). That is about 10 percentage points lower. The speed at 9 degrees is 10.96 m/s against about 9.5 m/s for Flow5 (interpolated), which is 1.5 m/s higher, and the glide ratio is 6.00 against 5.96 to 6.01 (B3 and B2).
8.4 Why the OpenFOAM wing flies faster than the Flow5 wing
Why the wing flies faster than with Flow5, and where the centre of pressure is (inferred from the two pressure files). The lift coefficient at 9 degrees is 0.534 in the OpenFOAM pressure file (billow wing) and 0.743 in the Flow5 pressure file used in the earlier flights, which is 28 % less (the reference areas are 20.73 and 20.94 m2). For the same lift, the weight of 817 N, the dynamic pressure has to be about 1.4 times higher and the speed about 1.18 times: q S CL of the OpenFOAM file at 10.96 m/s and 9 degrees is 816 N. The flown speeds follow this: 9.5 m/s for the Flow5 flights (interpolated) and 10.96 m/s for the OpenFOAM wing at 9 degrees. The Cm = 0 point of the closed wing, the centre of pressure of the wing alone, is at 28.4 % of the chord at 9 degrees in the Flow5 pressure file and at 20.8 % in the OpenFOAM flight. That is 7.6 percentage points of the chord further forward (measured from the totals of the two files). With the centre of pressure further forward, the wing needs a lower calage to fly at the same angle. The glide ratio at 9 degrees (6.00) is close to that of the Flow5 flights (5.96 to 6.01).
8.5 Forces, plumb point and Cm = 0 point
| Flight | Wing angle (deg) | OpenFOAM lift at this angle (N) | Playground wing lift (N) | OpenFOAM pressure drag incl. induced (N) | OpenFOAM friction (N) | Playground wing drag (N) | of which intake (N) | Lines (N) | Pilot (N) |
|---|---|---|---|---|---|---|---|---|---|
| C13-r4 | 8.00 | 817 | 825 | 52.4 | 16.0 | 71.1 | 2.0 | 43.7 | 28.8 |
| C20-r4 | 9.11 | 820 | 824 | 56.4 | 14.2 | 72.3 | 1.3 | 39.3 | 25.8 |
| C24p8-r5 | 9.99 | 822 | 823 | 59.9 | 13.1 | 73.9 | 0.9 | 36.4 | 23.8 |
Forces (measured). In the final flights the lift of the wing in the Playground is 825, 824 and 823 N against 817, 820 and 822 N of the OpenFOAM file read at the central-chord angle (within 1 %; the Playground reads the file at the angle of each face). The wing drag is the pressure drag of the file (induced drag included) plus the friction, plus the intake term of 0.9 to 2.0 N. The Playground adds the drag of the lines (36 to 44 N) and of the pilot (24 to 29 N).
Plumb point and Cm = 0 point (measured). The plumb point lies 14.0, 12.2 and 11.0 % of the chord behind the Cm = 0 point of the closed wing at 8, 9 and 10 degrees (plumb 34.4, 32.9, 32.1 %; Cm = 0 point 20.4, 20.8, 21.1 %). The gap is of the order that the drag of lines and pilot gives (inferred: 65 N acting several metres below the wing against a lift of 817 N is a shift of about 12 % of the chord at 9 degrees). The Cm = 0 point of the closed wing moves by less than 1 % of the chord between 8 and 10 degrees, whereas the plumb point moves by 2.3 percentage points. The wing is trimmed by the calage, not by a movement of the centre of pressure.
8.6 What still differs between the OpenFOAM wing and the Playground wing
The following differences remain between the CFD and the Playground, or between the model and the real wing. They are listed as causes of differences in the results, and none is quantified unless a number is given.
- The flow inside the wing. The effect of the cross flow between the cells is not known. The intake and the cell pressures rest on the 2D results, applied at the angle of each section. Not all cells have vents and the sections are twisted, so the angle changes along the span, and the 2D drag change taken at each section angle is an approximation.
- The trailing edge: 1 to 2 % of the drag is not in the model (section 8.1).
- The profile at the tip. In the design file the tip profile does not go to a line but keeps a thickness (the two tip ribs of the engine export are 1.6 mm thick). The Playground mesh flattens the tip to zero thickness, and the CFD surface (STL) pinches to a line (thinner than 0.5 mm within 1 mm of the end). The size of this difference in the results was not tested, and nothing was changed.
- Lines and pilot. The line drag (37 to 50 N) and the pilot drag (0.5 times density times 0.35 m2 times V squared, 25 to 33 N) are models of the Playground and of LEP, not CFD.
- The angle at which the Playground reads the file. The gnuA7 has a centre cell and no centre rib, while the CFD angle is measured to the central chord line (the gnuC2 has a real centre rib). Which angle the Playground should read the file at for this wing is not settled (wing 8.32, central chord 8.94 degrees).
- No aerodynamic reload on the relaxed (Newton) canopy was made with the OpenFOAM file.
- The CFD itself: wall functions, no transition model, billow valleys unresolved (sections 7 and 10). The 12 to 14 degree runs that stopped at the iteration cap lie above the flights at 8 to 10 degrees.
9. Corrections made along the way
| Earlier statement | What was found |
|---|---|
| The OpenFOAM runs are fully turbulent | There is no transition model; the layer turns turbulent over x/c 0.1 to 0.4; inlet turbulence from 0.1 to 2 % changes nothing. |
| kOmegaSST trips at 4.5 to 5 % chord | Withdrawn: it has no trip position; that figure came from a shape-factor criterion and from the lift matching a 5 % XFoil trip. |
| A stack that follows the boundary layer adds 4 to 7 % lift; the 165 mm mesh (CL 1.159) is the reference | Artefact of the gmsh fan at the sharp trailing edge; flat-base reference is 1.0634 and every earlier "gap closed" percentage is withdrawn. |
| The Belloc slope agreement is +7 % | At equal angle the lift is 0.024 to 0.078 above the tunnel and the zero-lift angle differs by 0.7 degrees; the paper applies no wall corrections; the wing is not the gnuA7. |
| The tunnel slope 3.01 per radian is a reference for the gnuA7 | It belongs to the Belloc wing; it is a referee for the codes only. |
| A Flow5 pressure file (a1) had a defect at the outer nose | 166 triangles (the worst-shaped ones, minimum angle median 9.9 degrees) carry Cp from 0 to -0.4 beside neighbours at -1.3 to -2.0; the effect on the total lift is +0.10 % (0.4 m2 of 20.9 m2); file b2 has none; Flow5 was not rerun. |
| The 17 mm stack at 15 degrees is a converged point | It is not: the plateau value is plotted and footnoted. |
10. What is not solved or not done
- No fully resolved 3D solution exists. A wall-resolved 3D mesh is not feasible with snappyHexMesh at the creases on this PC, so the accuracy of the 3D CL, CD and Cm with wall functions is untested.
- The insensitivity of the 3D result to the stack thickness is unexplained (section 7.3).
- The flow in the billow valleys is unresolved. No thick stack was ever built on the billow wing in 3D, and no other mesher gave a usable mesh (cfMesh was probed once). The billow mesh is not yet satisfactory, and the best method for the valleys is not decided.
- The real trailing edge is not modelled. The skins bulge into a rounded profile that runs into a seam about 1 cm long and 1 to 1.5 mm thick (cloth folded three or four times; the thickness is an estimate and is not resolved). The CFD uses a 0.70 mm flat base (section 4.3, Figure 5b). The analysis of the rounded end (its radius set by the internal pressure), the seam, the back and the mesh around them, at every angle of attack, has not been made.
- The trailing-edge check on a single cell of the gnuA7 in the Playground is not done. The single-cell check was made on the gnuC2 wing only.
- No 3D CFD above 14 degrees for the billow wing. The 12 to 14 degree runs stopped at the 700-iteration cap. The final flights of section 8.3 are at 8 to 10 degrees, below those runs. The 17 mm no-billow run at 15 degrees did not converge. Test transient runs and other solvers.
- The air intake is 2D and steady, for rib 1 only. There is no 3D intake and no spanwise exchange between cells. Only one intake geometry was run, the mouth mesh and the lip edge thickness were not studied, and the low-angle drag scatters by 4 to 10 %.
- The Belloc check is incomplete. Mast and balance interference, wall interference, incidence and twist against the paper's table, and transition at 0.5 % turbulence are untested. The cause of the offset in lift at equal angle is unknown. Too many unknowns to follow through with no real benefit.
- Pitching moment of the 2D foil against XFoil. The pitching moment about the quarter chord is 0.0144 in OpenFOAM against 0.0260 in XFoil (5 % trip) at 9 degrees, with no explanation. More checking required.
- Flow5 side. The 3D panel mesh of the nose is coarse (first panels 0.96 to 1.36 % of the chord) and a rebuild with cosine spacing was not made. Every Flow5 pressure file used an XFoil trip at 2 % chord, and a rerun at 5 % was not done (this changes the drag, not the lift).
- Mesh convergence. The coarse, medium and fine meshes are not asymptotic, so no grid-convergence index is valid. The local incidence of rib 1 against the frame, which matters for comparing the 2D foil with the 3D section, was not checked.
- Deformed shapes. No CFD was run on a deformed canopy with OpenFOAM, so the fluid-structure loop still uses Flow5 pressures. More checking required before running FSI.
- About 1 to 2 % of drag for the real trailing edge is not in the model. The Playground has an adjustable term for it, set to zero. Single cell analyses required to determine the thickness and trailing edge radius as a function of angle of attack.
- The tip profile differs between the design (1.6 mm thick), the Playground mesh (flattened to zero) and the CFD surface (pinched to a line). The effect on the results was not tested.
11. Future work
Checks and developments intended next. None of them has been done, and the expected effects are inferences, not results.
- A better 3D mesh in the billow valleys. Get a 3D CFD mesh with adequate resolution in the valleys of the billow wing before the 3D results are trusted (section 7).
- Transition in 3D. The 3D runs use kOmegaSST without a transition model, so the boundary layer turns turbulent within the first tenths of the chord. In 2D the transition model keeps the upper skin laminar to x/c 0.14, where the first seam of the real wing is, and the drag falls by 26 % with the lift 5 to 6 % higher (section 4.5). The check intended in 3D is to run the wing laminar over the front and let the flow trip only at 14 % of the chord or later (the transition model, or turbulence switched on from that position), and to see how much of the 3D drag this removes. From the 2D result the drag is expected to fall considerably, but this has not been tested in 3D.
- Playground flights on converged CFD. Converge the 12 to 14 degree runs of the billow wing and run it at 15 and 16 degrees, so that flights at larger angles (for example at lower speed or with a larger calage) no longer rest on runs at the iteration cap or on extrapolation. The flights at 8 to 10 degrees do not need it.
- Deformed canopy. Run OpenFOAM on the deformed canopy, so that the fluid-structure loop can use OpenFOAM pressures instead of Flow5 pressures. First clarify the centre of pressure and the wing drag difference.
- The flow inside the wing. At some stage, look at the effect of the cross flow between the cells on the pressures and the drag. For now the 2D results are used.
- Measurement on the real wing. The only way to check the real wing against this model is to point lasers upward to measure the plumb point relative to the wing in trim, together with the glider speed and the glide ratio. All of these are difficult to measure by hand, and the phugoid mode that is normally excited when doing this gives an oscillation, so a steady state is never reached.
12. Conclusion
- The 2D results look promising, but there is still much to learn with OpenFOAM. In 2D the accuracy of a wall-function mesh is set by the thickness of the prism stack in relation to the real boundary layer (6 to 148 mm on the upper skin at 9 degrees), not by y+ or by the cell size. A thin stack loses lift and gains drag, and a sharp trailing edge with the usual layer fan gives a wrong lift by up to 7 %. With a transition model the upper skin stays laminar to 14 % chord and the drag is 26 % lower. This has not yet been tried in 3D (section 11).
- The air intake does not change the lift of the foil. Its pressure is set by the stagnation pressure at the mouth and rises from about -0.3 at 0 degrees to 1.0 from 13 degrees.
- OpenFOAM with wall functions on a mesh that snappyHexMesh can build gives, for the gnuA7 without billow, a lift about 16 % below Flow5 at 9 degrees (CL 0.600 against 0.711) with the same lift-to-drag ratio. In a tunnel benchmark of a different wing the viscous code is 7 to 8 % above the measured lift slope and the other codes 17 to 31 %. Together these point to the panel method over-predicting the lift of a real canopy, while the absolute accuracy of the CFD is not established.
- In 3D the mesher builds only thin stacks, the billow creases stop even thin ones from being thick, and the 3D result did not respond to the stack. What this means for the accuracy of the 3D numbers is open. A better mesh in the valleys comes before the 3D results are trusted.
- The 0.70 mm flat base at the trailing edge is a numerical device. The real rounded trailing edge that runs into a seam about 1 cm long and 1 to 1.5 mm thick is not modelled, so its effect on the results is not known. Currently running 2D runs with various trailing edge thickness (radius).
- Playground. With the 3D billow pressures the Playground flies the gnuA7 at 8, 9 and 10 degrees at design calages of 13, 20 and 24.8 % of the central chord. At 9 degrees the speed is 10.96 m/s and the glide ratio 6.0, against about 9.5 m/s and 5.96 to 6.01 for the Flow5 flights of the earlier report (section 8.3). Whether the difference belongs to the wing or to the OpenFOAM pressures (valleys unresolved, wall functions, no transition model) is open.
- Mismatch between OpenFOAM and Flow5 at the trim speed. The drag and the centre of pressure of the OpenFOAM wing differ from those of Flow5. As a result the calage has to be lowered to fly at 9 degrees, and the wing then flies at a higher speed than with Flow5 (section 8.4).
- The flow inside the wing is not known. The effect of the internal cross flow is not known and the Playground relies on the 2D results for the intake. This is to be looked at at some stage.
- The real wing. The only way to check the real wing is to point lasers upward to check the plumb point relative to this model while in trim mode, together with the glider speed and the glide ratio. All of these are difficult to measure by hand. When this is done the phugoid mode is normally excited and gives an oscillation, so a steady state is never reached. Testing and pilot feedback is crucial.